
Page 47 - Statistics for Environmental Engineers
P. 47
L1592_frame_C03 Page 38 Tuesday, December 18, 2001 1:41 PM
15 32 2 10 9 11 3596
16 3 1 8 36 1 1219
17 10 2 1 72 6 3136
18 17.2 1.8 2.1 69.8 3.8 3708
19 31 7 3 36 7 3945
20 21 5.7 3.9 50 6.2 3500
21 12.2 2.7 1.3 42.6 1 2038
22 22.2 3.2 11.9 50 6.2 3558
23 28 6 7 48 0.1 3219
24 15.5 4.5 2.5 51.5 2 2651
25 38.2 2 7.5 30.4 6.5 3953
26 2.2 2.2 1.75 52.5 1.2 1574
27 17 2 5 43 4 2649
28 24 9 8 53 2 3462
29 43 3 1 5 6 3640
30 18 4 3 50 4 2555
31 8 1 6 80 1 2595
32 4 3 30 2.6 1418
33 50 7 8 15 8 4792
34 8 1 3 25 2 1378
35 28.9 9.3 10.4 17.8 3.4 3088
Source: Khan, et al., J. Envir. Eng., ASCE, 117, 376, 1991.
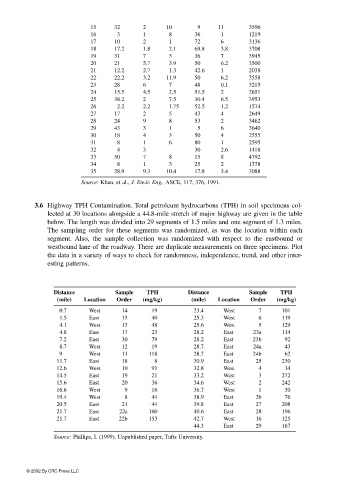
3.6 Highway TPH Contamination. Total petroleum hydrocarbons (TPH) in soil specimens col-
lected at 30 locations alongside a 44.8-mile stretch of major highway are given in the table
below. The length was divided into 29 segments of 1.5 miles and one segment of 1.3 miles.
The sampling order for these segments was randomized, as was the location within each
segment. Also, the sample collection was randomized with respect to the eastbound or
westbound lane of the roadway. There are duplicate measurements on three specimens. Plot
the data in a variety of ways to check for randomness, independence, trend, and other inter-
esting patterns.
Distance Sample TPH Distance Sample TPH
(mile) Location Order (mg/kg) (mile) Location Order (mg/kg)
0.7 West 14 19 23.4 West 7 101
1.5 East 15 40 25.3 West 6 119
4.1 West 13 48 25.6 West 5 129
4.8 East 17 23 28.2 East 23a 114
7.2 East 30 79 28.2 East 23b 92
8.7 West 12 19 28.7 East 24a 43
9 West 11 118 28.7 East 24b 62
11.7 East 18 8 30.9 East 25 230
12.6 West 10 91 32.8 West 4 14
14.5 East 19 21 33.2 West 3 272
15.6 East 20 36 34.6 West 2 242
16.6 West 9 16 36.7 West 1 30
19.4 West 8 44 38.9 East 26 76
20.5 East 21 44 39.8 East 27 208
21.7 East 22a 160 40.6 East 28 196
21.7 East 22b 153 42.7 West 16 125
44.3 East 29 167
Source: Phillips, I. (1999). Unpublished paper, Tufts University.
© 2002 By CRC Press LLC