Page 46 - Statistics for Environmental Engineers
P. 46

L1592_frame_C03  Page 37  Tuesday, December 18, 2001  1:41 PM


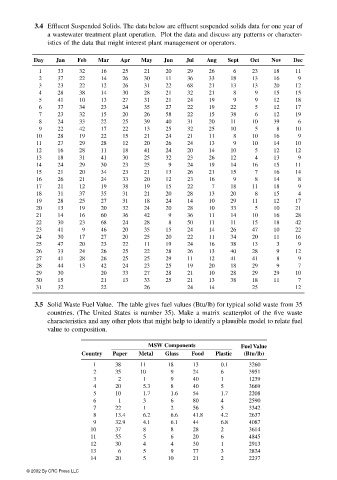
                         3.4 Effluent Suspended Solids. The data below are effluent suspended solids data for one year of
                             a wastewater treatment plant operation.  Plot the data and discuss any patterns or character-
                             istics of the data that might interest plant management or operators.

                         Day   Jan   Feb   Mar   Apr   May   Jun   Jul   Aug   Sept  Oct   Nov   Dec
                          1    33    32    16    25    21    20    29    26     6    23    18    11
                          2    37    22    14    26    30    11    36    33    18    13    16     9
                          3    23    22    12    26    31    22    68    21    13    13    20    12
                          4    28    38    14    30    28    21    32    21     8     9    15    15
                          5    41    10    13    27    31    21    24    19     9     9    12    18
                          6    37    34    23    24    35    27    22    19    22     5    12    17
                          7    23    32    15    20    26    58    22    15    38     6    12    19
                          8    24    33    22    25    39    40    31    20    11    10    39     6
                          9    22    42    17    22    13    25    32    25    10     5     8    10
                         10    28    19    22    15    21    24    21    11     8    10    16     9
                         11    27    29    28    12    20    26    24    13     9    10    14    10
                         12    16    28    11    18    41    24    20    14    10     5    12    12
                         13    18    31    41    30    25    32    23    26    12     4    13     9
                         14    24    29    30    23    25     9    24    19    14    16    15    11
                         15    21    20    34    23    21    13    26    21    15     7    16    14
                         16    26    21    24    33    20    12    23    16     9     8    14     8
                         17    21    12    19    38    19    15    22     7    18    11    18     9
                         18    31    37    35    31    21    20    28    13    20     8    15     4
                         19    28    25    27    31    18    24    14    10    29    11    12    17
                         20    13    19    20    32    24    20    28    10    33     5    10    21
                         21    14    16    60    36    42     9    36    11    14    10    16    28
                         22    30    23    68    24    28     8    50    11    11    15    18    42
                         23    41     9    46    20    35    15    24    14    26    47    10    22
                         24    30    17    27    20    25    20    22    11    34    20    11    16
                         25    47    20    23    22    11    19    24    16    38    13     3     9
                         26    33    24    26    25    22    28    26    13    40    28     9    12
                         27    41    28    26    25    25    29    11    12    41    41     8     9
                         28    44    13    42    24    23    25    19    20    18    29     9     7
                         29    30          20    33    27    28    21    10    28    29    29    10
                         30    15          21    13    33    25    21    13    38    18    11     7
                         31    32          22          26          24    14          25          12

                         3.5 Solid Waste Fuel Value.  The table gives fuel values (Btu/lb) for typical solid waste from 35
                             countries. (The United States is number 35). Make a matrix scatterplot of the  five waste
                             characteristics and any other plots that might help to identify a plausible model to relate fuel
                             value to composition.
                                                         MSW Components           Fuel Value
                                      Country  Paper  Metal  Glass   Food  Plastic  (Btu/lb)
                                         1     38     11      18     13      0.1     3260
                                         2     35     10       9     24      6       3951
                                         3      2      1       9     40      1       1239
                                         4     20      5.3     8     40      5       3669
                                         5     10      1.7     1.6   54      1.7     2208
                                         6      1      3       6     80      4       2590
                                         7     22      1       2     56      5       3342
                                         8     13.4    6.2     6.6   41.8    4.2     2637
                                         9     32.9    4.1     6.1   44      6.8     4087
                                         10    37      8       8     28      2       3614
                                         11    55      5       6     20      6       4845
                                         12    30      4       4     30      1       2913
                                         13     6      5       9     77      3       2824
                                         14    20      5      10     21      2       2237
                       © 2002 By CRC Press LLC
   41   42   43   44   45   46   47   48   49   50   51