
Page 45 - Statistics for Environmental Engineers
P. 45
L1592_frame_C03 Page 36 Tuesday, December 18, 2001 1:41 PM
Farquhar, A. B. and H. Farquhar (1891). “Economic and Industrial Delusions: A Discourse of the Case for
Protection,” New York, Putnam.
Gameson, A. L. H., G. A. Truesdale, and M. J. Van Overdijk (1961). “Variation in Performance of Twelve
Replicate Small-Scale Percolating Filters,” Water and Waste Treatment J., 9, 342–350.
Hunter, J. S. (1988). “The Digidot Plot,” Am. Statistician, 42, 54.
Tufte, E. R. (1983). The Visual Display of Quantitative Information, Cheshire, CN, Graphics Press.
Tufte, E. R. (1990). Envisioning Information, Cheshire, CN, Graphics Press.
Tufte, E. R. (1997). Visual Explanations, Cheshire, CN, Graphics Press.
Tukey, J. W. (1977). Exploratory Data Analysis, Reading, MA, Addison-Wesley.
Tukey, J. W. (1990). “Data Based Graphics: Visual Display in the Decades to Come,” Stat. Sci., 5, 327–329.
Wainer, H. (1997). Visual Revelations: Graphical Tales of Fate and Deception from Napoleon Boneparte to
Ross Perot, New York, Copernicus, Springer-Verlag.
Exercises
3.1 Box-Whisker Plot. For the 11 ordered observations below, make the box-whisker plot to show
the median, the upper and lower quartiles, and the upper and lower cut-off.
36 37 45 52 56 58 66 68 75 90 100
3.2 Phosphorus in Sludge. The values below are annual average concentrations of total phosphorus
in municipal sewage sludge, measured as percent of dry weight solids. Time runs from right
to left. The first value is for 1979. Make several plots of the data to discover any trends or
patterns. Try to explain any patterns you discover.
2.7 2.5 2.3 2.4 2.6 2.7 2.6 2.7 2.3 2.9 2.8
2.5 2.6 2.7 2.8 2.6 2.4 2.7 3.0 4.5 4.5 4.3
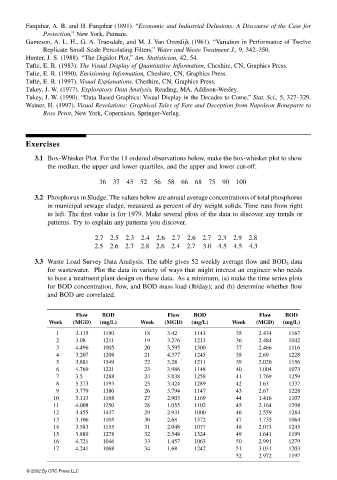
3.3 Waste Load Survey Data Analysis. The table gives 52 weekly average flow and BOD 5 data
for wastewater. Plot the data in variety of ways that might interest an engineer who needs
to base a treatment plant design on these data. As a minimum, (a) make the time series plots
for BOD concentration, flow, and BOD mass load (lb/day); and (b) determine whether flow
and BOD are correlated.
Flow BOD Flow BOD Flow BOD
Week (MGD) (mg/L) Week (MGD) (mg/L) Week (MGD) (mg/L)
1 3.115 1190 18 3.42 1143 35 2.434 1167
2 3.08 1211 19 3.276 1213 36 2.484 1042
3 4.496 1005 20 3.595 1300 37 2.466 1116
4 3.207 1208 21 4.377 1245 38 2.69 1228
5 3.881 1349 22 3.28 1211 39 2.026 1156
6 4.769 1221 23 3.986 1148 40 1.004 1073
7 3.5 1288 24 3.838 1258 41 1.769 1259
8 5.373 1193 25 3.424 1289 42 1.63 1337
9 3.779 1380 26 3.794 1147 43 2.67 1228
10 3.113 1168 27 2.903 1169 44 1.416 1107
11 4.008 1250 28 1.055 1102 45 2.164 1298
12 3.455 1437 29 2.931 1000 46 2.559 1284
13 3.106 1105 30 2.68 1372 47 1.735 1064
14 3.583 1155 31 2.048 1077 48 2.073 1245
15 3.889 1278 32 2.548 1324 49 1.641 1199
16 4.721 1046 33 1.457 1063 50 2.991 1279
17 4.241 1068 34 1.68 1242 51 3.031 1203
52 2.972 1197
© 2002 By CRC Press LLC