
Page 182 - The Geological Interpretation of Well Logs
P. 182
- THE GEOLOGICAL INTERPRETATION OF WELL LOGS -
STANDARD RESISTIVITY Qm?/m SHDT
resistivity
—e
1 19 100 1900
177m
meas uring
electrodes
bem
e
1800m
PS
“SHOT DIPMETER
PAD
ek J -upt pap
1825m
at eee ata Pe ae fe tie eye.
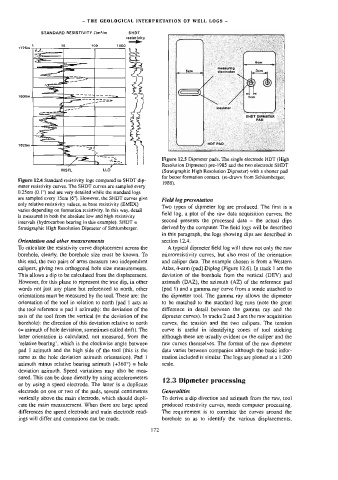
Figure 12.5 Dipmeter pads. The single electrode HDT (High
Resolution Dipmeter) pre-1985 and the two electrode SHDT
MSFL LLO (Stratigraphic High Resolution Dipmeter) with 2 shorter pad
for better formation contact. (re-drawn from Schlumberger,
Figure 12.4 Standard resistivity logs compared to SHDT dip-
1986).
meter resistivity curves. The SHDT curves are sampled every
0.25cm (0.1") and are very detailed while the standard logs
are sampled every 15cm (6"). However, the SHDT curves give
Field log presentation
only relative resistivity values, as base resistivity (EMEX)
Two types of dipmeter log are produced. The first is a
vanes depending on formation resistivity. In this way, detail
field log, a plot of the raw data acquisition curves; the
is measured in both the absolute low and high resistivity
second presents the processed data — the actual dips
intervals (hydrocarbon bearing in this example). SHDT =
Stratigraphic High Resolution Dipmeter of Schlumberger. derived by the computer. The field logs will be described
in this paragraph, the logs showing dips are described in
Orientation and other measurements section 12.4.
To calculate the resistivity curve displacement across the A typical dipmeter field log will show not only the raw
borehole, clearly, the borehole size must be known. To microresistivity curves, but also most of the orientation
this end, the two pairs of arms measure two independent and caliper data. The example chosen is from a Western
calipers, giving two orthogonal hole size measurements. Alas, 4-arm (pad) Diplog (Figure 12.6). In track 1 are the
This allows a dip to be calculated from the displacement. deviation of the borehole from the vertical (DEV) and
However, for this plane to represent the true dip, in other azimuth (DAZ), the azimuth (AZ) of the reference pad
words not just any plane but referenced to north, other (pad 1) and a gamma ray curve from a sonde attached to
orientations must be measured by the tool. These are: the the dipmeter tool. The gamma ray allows the dipmeter
orientation of the too] in relation to north (pad J acts as to be matched to the standard log rums (note the great
the tool reference = pad | azimuth): the deviation of the difference in detail between the gamma ray and the
axis of the tool from the vertical (= the deviation of the dipmeter curves), In tracks 2 and 3 are the raw acquisition
borehole): the direction of this deviation relative to north curves, the tension and the two calipers. The tension
(= azimuth of hole deviation, sometimes called drift). The curve is useful in identifying zones of tool sticking
latter orientation is calculated, not measured, from the although these are usually evident on the caliper and the
‘relative bearing’, which is the clockwise angle between raw curves themselves. The format of the raw dipmeter
pad | azimuth and the high side of the tool (this is the data varies between companies although the basic infor-
same as the hole deviation azimuth orientation), Pad 1] mation included is similar. The logs are plotted at a 1:200
azimuth minus yselative bearing azimuth (+360°) = hole scale.
deviation azimuth. Speed variations may also be mea-
sured. This can be done directly by using accelerometers
12.3 Dipmeter processing
or by using a speed electrode. The latter is a duplicate
electrode on one or two of the pads, several centimetres Generalities
vertically above the main electrode, which should dupli- To derive a dip direction and azimuth from the raw, tool
cate the main measurement. When there are large speed produced resistivity curves, needs computer processing.
differences the speed electrode and main electrode read- The requirement is to correlate the curves around the
ings will differ and corrections can be made. 172 borehole so as to identify the various displacements,