
Page 184 - The Geological Interpretation of Well Logs
P. 184
- THE GEOLOGICAL [INTERPRETATION OF WELL LOGS -
Fixed interval correlation methods For instance, if a search angle of 50° is chosen, curve nvo
Fixed interval correlation methods are the most common- will be searched along a length sufficient to give 50°
ly used. Dip computation is based on a comparison and dips and no higher (the actual length varies with size of
correlation of the microresistivity curves over short, fixed borehole}. Such correlations are made on ali possible
vertical intervals or depths (Figure 12.7). The calculated combinations, being 6 with 4 microresistivity curves,
correlation gives a curve displacement from which, with 15 with 6 curves, 28 with 8 curves. The displacements
a minimum of three displacements around the borehole, a derived from the correlations are then used to define a
dip and azimuth can be derived. Several parameters are plane — the dip. The entire process is begun again in the
varied by the computer operator and are chosen depend- interval above according to the step distance. Typically
ing on the perceived interpretation requirements. The this next interva] will re-use the top 50% of the previous
three principal parameters to choose are the correlation correlation interval. That is, if the correlation interval is |
interval, the search angle and the step distance (Figure metre, the step distance will be 50 cm and the overlap will
12.8). The correlation interval is the fixed depth interval, be 50% (Figure 12.8).
or more properly the length of microresistivity curve used It is helpful to general understanding to examine the
for correlation, usually between 0.1 m (10 cm) and 2 m. actual process of curve correlation. The system is one of
The search angle defines the Jength of curve over which a cross-multiplication. A graphic representation of this,
correlation is searched for on a second curve, typically called a correlogram, shows that when the two curves are
sufficient to give up to 70° of dip in the borehole’s frame most similar, there is a maximum cross-multiplication
of reference. (Schlumberger often quote a search angle of product (Figure 12.9), That is, when the two curves are
35° X 2, which means that the computer will search up to most similar, the correlogram has a marked peak, which
35° on the first pass but if it really finds nothing, will is the correlation point and is taken as the curve displace-
eventually search another 35°. This is a technique to save ment for dip calculation. When there is no peak, the two
computer time). The third parameter, the step distance, is curves show no similarity. Mathematical tests for the
the length of curve moved between one level of correla- quality of the computed dip can be made, for example
tion and the next above (computation is always from the by using the shape of the correlogram. Most dipmeter
bottom upwards). Typically this amount is half (50%) of programmes give a quality rating scale to each dip and
the correlation interval or a step ratio of 0.5 (Figure 12.8). azimuth value of say 0-1 or 1-10. A simplified quality
In more detail, the fixed interval method works as fol- is usually indicated on the final dip and azimuth plots
lows. The length of microresistivity curve one to be used or else quality cut-offs are applied, below which the
is defined by the correlation interval, say 1 metre. This computed dips are simply not plotted (Section 12.5).
length of curve one is compared to microresistivity curve
Standard processing parameter variation
two, using cross-multiplication (see below) by moving
The result of a fixed interval correlation programme is 4
curve one in increments along curve nvo. The length of
regular series of dip and azimuth readings with a depth
curve fwo which is used is defined by the search angle.
at the centre point of every correlation interval and sepa-
rated vertically by the step distance increment. However,
with a single set of raw dipmeter data, a whole series of
processed dipmeter logs can be produced, by varying the
processing parameters.
3 +
9
shift
SEARCH
ANGLE <n
curve er
-—- 749
positions
shift
3
i
2
4
6
6
a
7
co
2
we
e3
§ shift positions
F
T
T
T
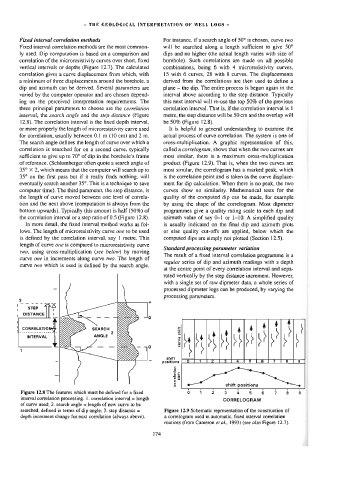
Figure 12.8 The features which must be defined for a fixed o- =+ N 3 4 5 6 7 8B
interval correlation processing. 1. correlation interval = length CORRELOGRAM
of curve used; 2. search angle = length of new curve to be
searched, defined in terms of dip angle: 3. step distance = Figure 12.9 Schematic representation of the construction of
depth increment change for next correlation (always above). a correlogram used in automatic, fixed interval correlation
routines (from Cameron et al,, 1993) (see also Figure 12.7).