Page 183 - The Geological Interpretation of Well Logs
P. 183

~  THE  DIPMETER  -


       which  then  define  a  surface  across  the  hole.  There  are   are  only  for  detailed  work.
       two  principal  methods:  fixed  interval  correlation  and   It  is  essential  to  understand  the  general  principles  of
      feature  recognition.  Fixed  interval  correlation  is  the  most   dipmeter  processing;  proper  interpretation  depends  on  it.
       common  method  used  and  simplest  for  the  computer  but   This  will  be  demonstrated  subsequently,  It  is  not  neces-
       feature  recognition  imitates  the  way  the  human  eye   sary  to  know  the  details  of  the  computer  programmes,
       works.  Processing  is  normally  done  automatically  by  the   which  vary  between  companies,  but  the  basic,  consistent-
       computer,  but  a  modern  development  is  the  possibility  of   ly  used  principles  must  be  understood.  The  essentials  of
       correlating  the  curves  and  producing  dips  interactively  on   the  two  methods  (fixed  interval  and  feature  recognition)
       the  computer  screen  (Figure  12.7).  Interactive  methods   will  be  described  separately  below.

                          Gamma  Ray  (API)   matres   PAD  1   PAD  2   AD  3   PAD  4
                                                            oo
                                                      TENSION  {LBS)    X-CALIPER  (INCH)
                             DEV  (DEG)
                                                                        Y-CALIPER  (INCH)
                              AZ  (DEG)


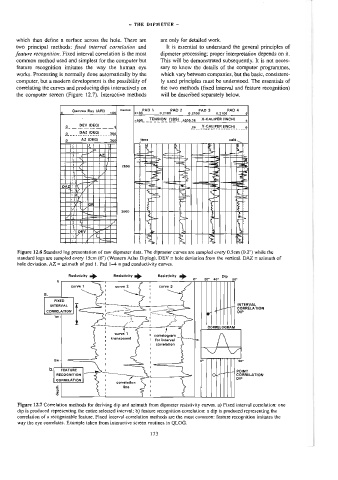
       Figure  12.6  Standard  log  presentation  of  raw  dipmeter  data,  The  dipmeter  curves  are  sampled  every  0.5cm  (0.2”)  while  the
       standard  logs  are  sampled  every  15cm  (6"}  (Western  Atlas  Diplog).  DEV  =  hole  deviation  from  the  vertical.  DAZ  =  azimuth  of
       hole  deviation.  AZ  =  azimuth  of  pad  }.  Pad  1-4  =  pad  conductivity  curves.
                         Resistivity  a>   Resistivity  mi»   Resistivity   =>   o   20°   40°  Dip   30°

                     9                T
                                                         curve  3
                          curva  1    !   curve  2
                 a              ae    {  ;     ae


                                  !
                    FIXED
                   INTERVAL        =                                                INTERVAL
                                       es
                 CORRELATION          J                                             CORRELATION
                    im                Ve  oe
                                                                                    OIP
                                      1
                                      I

                                                                          CORRELOGRAM
                                         curve  1
                                                       correlogram
                                        transposed
                                                       for  interval
                                                        correlation

                                                                                 MY
                                                                        NSF
                                                                       o             90°
                    2m  4

                  D.[   FEATURE       ‘
                                                                                    POINT
                     RECOGNITION
                                      {                                             CORRELATION
                                                                                    DIP
                     CORRELATION       !
                                          correlation
                                      1     line
                      depth           {  1

       Figure  12.7  Correlation  methods  for  deriving  dip  and  azimuth  from  dipmeter  resistivity  curves.  a)  Fixed  interval  correlation:  one
       dip  is  produced  representing  the  entire  selected  interval;  b)  feature  recognition  correlation:  a  dip  is  produced  representing  the
       correlation  of  a  recognizable  feature.  Fixed  interval  correlation  methods  are  the  most  common:  feature  recognition  imitates  the
       way  the  eye  correlates.  Example  taken  from  interactive  screen  routines  in  QLOG.
                                                      173
   178   179   180   181   182   183   184   185   186   187   188