
Page 480 - The Mechatronics Handbook
P. 480
0066_frame_C19 Page 102 Wednesday, January 9, 2002 5:32 PM
L R
range(Z) Camera
Field of
step (dz)
k View
dq
j Q
Analysis
Window
local i
pattern
F
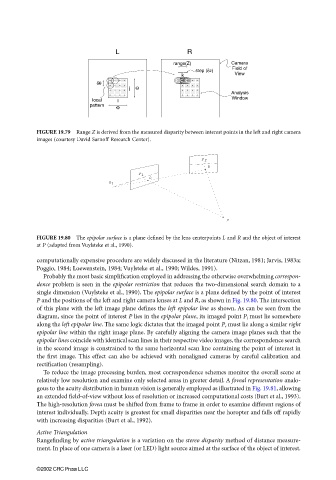
FIGURE 19.79 Range Z is derived from the measured disparity between interest points in the left and right camera
images (courtesy David Sarnoff Research Center).
FIGURE 19.80 The epipolar surface is a plane defined by the lens centerpoints L and R and the object of interest
at P (adapted from Vuylsteke et al., 1990).
computationally expensive procedure are widely discussed in the literature (Nitzan, 1981; Jarvis, 1983a;
Poggio, 1984; Loewenstein, 1984; Vuylsteke et al., 1990; Wildes, 1991).
Probably the most basic simplification employed in addressing the otherwise overwhelming correspon-
dence problem is seen in the epipolar restriction that reduces the two-dimensional search domain to a
single dimension (Vuylsteke et al., 1990). The epipolar surface is a plane defined by the point of interest
P and the positions of the left and right camera lenses at L and R, as shown in Fig. 19.80. The intersection
of this plane with the left image plane defines the left epipolar line as shown. As can be seen from the
diagram, since the point of interest P lies in the epipolar plane, its imaged point P l must lie somewhere
along the left epipolar line. The same logic dictates that the imaged point P r must lie along a similar right
epipolar line within the right image plane. By carefully aligning the camera image planes such that the
epipolar lines coincide with identical scan lines in their respective video images, the correspondence search
in the second image is constrained to the same horizontal scan line containing the point of interest in
the first image. This effect can also be achieved with nonaligned cameras by careful calibration and
rectification (resampling).
To reduce the image processing burden, most correspondence schemes monitor the overall scene at
relatively low resolution and examine only selected areas in greater detail. A foveal representation analo-
gous to the acuity distribution in human vision is generally employed as illustrated in Fig. 19.81, allowing
an extended field-of-view without loss of resolution or increased computational costs (Burt et al., 1993).
The high-resolution fovea must be shifted from frame to frame in order to examine different regions of
interest individually. Depth acuity is greatest for small disparities near the horopter and falls off rapidly
with increasing disparities (Burt et al., 1992).
Active Triangulation
Rangefinding by active triangulation is a variation on the stereo disparity method of distance measure-
ment. In place of one camera is a laser (or LED) light source aimed at the surface of the object of interest.
©2002 CRC Press LLC