
Page 845 - The Mechatronics Handbook
P. 845
0066_frame_C27 Page 6 Wednesday, January 9, 2002 7:10 PM
difference between the actual magnitude curve and the asymptotic approximation is a function of
damping ratio. The resonant frequency ω r is defined as the frequency where the peak value of the
frequency response M r occurs. When the damping ratio approaches zero, ω r approaches ω n . The resonant
frequency can be determined by taking the derivative of the magnitude with respect to the frequency,
and setting it equal to zero. The resonant frequency and the peak value of the magnitude are represented by
w r = w n 12V , ς < 0.707 (27.9a)
2
–
and
1
M r = -----------------------, V < 0.707 (27.9b)
2V 1 V 2
–
Example 2
Let us consider the transfer function
10 s/5 + 1)
(
Gs() = ----------------------------------------------------------------------
(
[
(
ss + 1) s/10) + ( s/10) + 1]
2
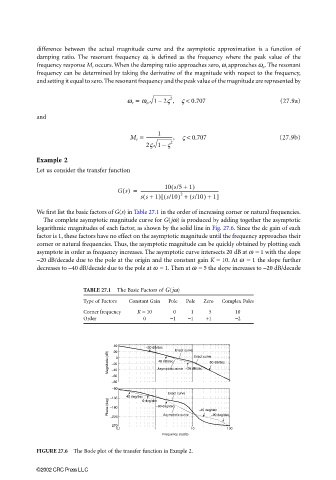
We first list the basic factors of G(s) in Table 27.1 in the order of increasing corner or natural frequencies.
The complete asymptotic magnitude curve for G(jω) is produced by adding together the asymptotic
logarithmic magnitudes of each factor, as shown by the solid line in Fig. 27.6. Since the dc gain of each
factor is 1, these factors have no effect on the asymptotic magnitude until the frequency approaches their
corner or natural frequencies. Thus, the asymptotic magnitude can be quickly obtained by plotting each
asymptote in order as frequency increases. The asymptotic curve intersects 20 dB at ω = 1 with the slope
−20 dB/decade due to the pole at the origin and the constant gain K = 10. At ω = 1 the slope further
decreases to −40 dB/decade due to the pole at ω = 1. Then at ω = 5 the slope increases to −20 dB/decade
TABLE 27.1 The Basic Factors of G(jω)
Type of Factors Constant Gain Pole Pole Zero Complex Poles
Corner frequency K = 10 0 1 5 10
Order 0 −1 −1 +1 −2
40
−20 dB/dec Exact curve
20
Magnitude (dB) −20 0 −40 dB/dec −20 dB/dec −60 dB/dec
Exact curve
Asymptotic curve
−40
−60
−80
−90
Exact curve
−45 deg/dec
−135 0 deg/dec
Phase (deg) −180 −90 deg/dec −45 deg/dec
−225 Asymptotic curve −90 deg/dec
−270
0.1 1 10 100
Frequency (rad/s)
FIGURE 27.6 The Bode plot of the transfer function in Exmple 2.
©2002 CRC Press LLC