
Page 850 - The Mechatronics Handbook
P. 850
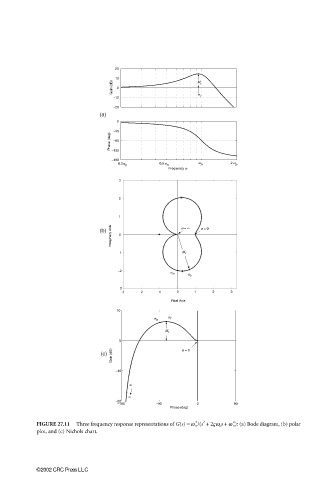
0066_frame_C27  Page 11  Wednesday, January 9, 2002  7:10 PM


                                              20
                                              10                        M
                                             Gain (dB)  0               r
                                              −10                       w   r
                                              −20
                                          (a)
                                               0
                                              −45
                                             Phase (deg)  −135
                                              −90

                                             −180
                                                0.2 w       0.5 w      w          2 w
                                                 n            n         n         n
                                                              Frequency  w
                                               3

                                               2


                                               1
                                             Imaginary Axis  0
                                          (b)                      w = ∞     w = 0


                                               −1                   M r

                                               −2                 •      •
                                                               w n
                                                                     w r
                                               −3
                                                −3   −2    −1    0    1    2     3
                                                               Real Axis
                                               10
                                                          w     w r
                                                          n
                                                            •   •
                                                               M r
                                               0
                                             Gain (dB)
                                          (c)                       w = 0

                                              −10
                                                    ω
                                                   ∞
                                              −20
                                               −180       −90          0          90
                                                               Phase (deg)
                                                                         2
                                                                           V
                       FIGURE 27.11  Three frequency response representations of G(s) = w n 2 /(s  + 2 ω n s + w n 2 ): (a) Bode diagram, (b) polar
                       plot, and (c) Nichols chart.


                       ©2002 CRC Press LLC