
Page 847 - The Mechatronics Handbook
P. 847
0066_frame_C27 Page 8 Wednesday, January 9, 2002 7:10 PM
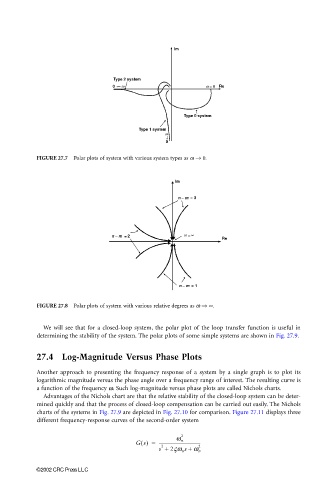
FIGURE 27.7 Polar plots of system with various system types as ω → 0.
FIGURE 27.8 Polar plots of system with various relative degrees as ω → ∞.
We will see that for a closed-loop system, the polar plot of the loop transfer function is useful in
determining the stability of the system. The polar plots of some simple systems are shown in Fig. 27.9.
27.4 Log-Magnitude Versus Phase Plots
Another approach to presenting the frequency response of a system by a single graph is to plot its
logarithmic magnitude versus the phase angle over a frequency range of interest. The resulting curve is
a function of the frequency ω. Such log-magnitude versus phase plots are called Nichols charts.
Advantages of the Nichols chart are that the relative stability of the closed-loop system can be deter-
mined quickly and that the process of closed-loop compensation can be carried out easily. The Nichols
charts of the systems in Fig. 27.9 are depicted in Fig. 27.10 for comparison. Figure 27.11 displays three
different frequency-response curves of the second-order system
2
Gs() = -------------------------------------
ω n
s + 2Vw n s + ω n 2
2
©2002 CRC Press LLC