
Page 848 - The Mechatronics Handbook
P. 848
0066_frame_C27 Page 9 Wednesday, January 9, 2002 7:10 PM
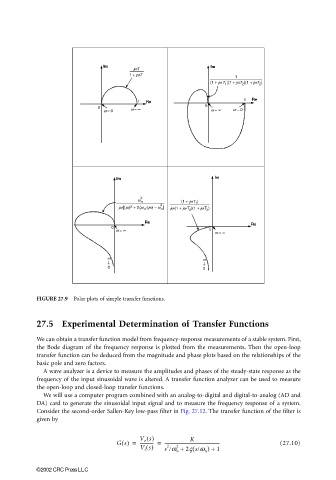
FIGURE 27.9 Polar plots of simple transfer functions.
27.5 Experimental Determination of Transfer Functions
We can obtain a transfer function model from frequency-response measurements of a stable system. First,
the Bode diagram of the frequency response is plotted from the measurements. Then the open-loop
transfer function can be deduced from the magnitude and phase plots based on the relationships of the
basic pole and zero factors.
A wave analyzer is a device to measure the amplitudes and phases of the steady-state response as the
frequency of the input sinusoidal wave is altered. A transfer function analyzer can be used to measure
the open-loop and closed-loop transfer functions.
We will use a computer program combined with an analog-to-digital and digital-to-analog (AD and
DA) card to generate the sinusoidal input signal and to measure the frequency response of a system.
Consider the second-order Sallen-Key low-pass filter in Fig. 27.12. The transfer function of the filter is
given by
V o s()
K
Gs() = ------------ = ------------------------------------------------- (27.10)
V i s() s /w n + 2V s/w n ) + 1
(
2
2
©2002 CRC Press LLC