
Page 930 - The Mechatronics Handbook
P. 930
0066_Frame_C30 Page 41 Thursday, January 10, 2002 4:45 PM
Sensitivity Singular Values at Error
5
0
−5
Singular Values (dB) −10
−15
−20
−25
−30
10 −1 10 0 10 1 10 2
Frequency (rad/sec)
FIGURE 30.16 PUMA 560 sensitivity frequency response at error.
Closed Loop Singular Values (r to y)
10
0
−10
Singular Values (dB) −20
−30
−40
−50
−60
10 −1 10 0 10 1 10 2
Frequency (rad/sec)
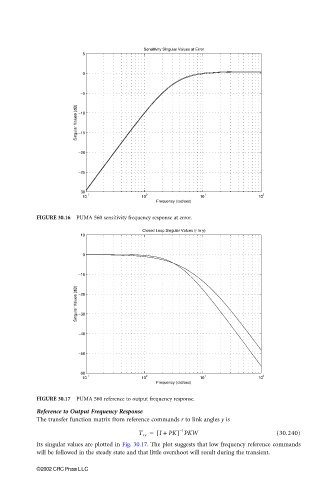
FIGURE 30.17 PUMA 560 reference to output frequency response.
Reference to Output Frequency Response
The transfer function matrix from reference commands r to link angles y is
T ry = [ I + PK] PKW (30.240)
1
–
Its singular values are plotted in Fig. 30.17. The plot suggests that low frequency reference commands
will be followed in the steady state and that little overshoot will result during the transient.
©2002 CRC Press LLC