Page 932 - The Mechatronics Handbook
P. 932

0066_Frame_C30  Page 43  Thursday, January 10, 2002  4:45 PM


                                                    Response to Step Reference Command for θ
                                                                            2
                                    1.2

                                     1


                                    0.8


                                   Outputs (deg)  0.6


                                    0.4

                                    0.2


                                     0


                                   −0.2
                                     0    0.2   0.4  0.6  0.8   1    1.2  1.4  1.6   1.8  2
                                                            Time (seconds)
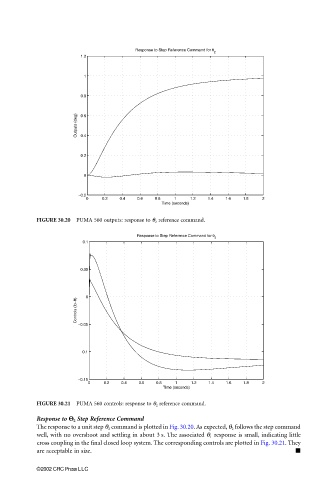
                       FIGURE 30.20  PUMA 560 outputs: response to θ 2  reference command.

                                                     Response to Step Reference Command for θ
                                                                            2
                                    0.1


                                    0.05


                                     0
                                   Controls (lb–ft)


                                   −0.05


                                    −0.1


                                   −0.15
                                      0    0.2  0.4  0.6  0.8   1    1.2  1.4  1.6   1.8  2
                                                            Time (seconds)

                       FIGURE 30.21  PUMA 560 controls: response to θ 2  reference command.
                       Response to ΘΘ ΘΘ  Step Reference Command
                                  22 2 2
                       The response to a unit step θ 2  command is plotted in Fig. 30.20. As expected, θ 2  follows the step command
                       well, with no overshoot and settling in about 3 s. The associated q 1  response is small, indicating little
                       cross coupling in the final closed loop system. The corresponding controls are plotted in Fig. 30.21. They
                       are acceptable in size.


                       ©2002 CRC Press LLC
   927   928   929   930   931   932   933   934   935   936   937