
Page 364 - Vibrational Spectroscopic Imaging for Biomedical Applications
P. 364
338 Cha pte r Ele v e n
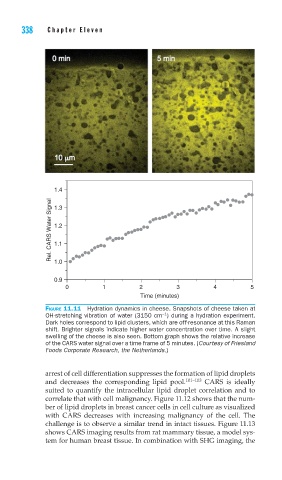
1.4
Rel. CARS Water Signal 1.2
1.3
1.1
1.0
0.9
0 1 2 3 4 5
Time (minutes)
FIGURE 11.11 Hydration dynamics in cheese. Snapshots of cheese taken at
−1
OH-stretching vibration of water (3150 cm ) during a hydration experiment.
Dark holes correspond to lipid clusters, which are off-resonance at this Raman
shift. Brighter signals indicate higher water concentration over time. A slight
swelling of the cheese is also seen. Bottom graph shows the relative increase
of the CARS water signal over a time frame of 5 minutes. (Courtesy of Friesland
Foods Corporate Research, the Netherlands.)
arrest of cell differentiation suppresses the formation of lipid droplets
and decreases the corresponding lipid pool. 101–103 CARS is ideally
suited to quantify the intracellular lipid droplet correlation and to
correlate that with cell malignancy. Figure 11.12 shows that the num-
ber of lipid droplets in breast cancer cells in cell culture as visualized
with CARS decreases with increasing malignancy of the cell. The
challenge is to observe a similar trend in intact tissues. Figure 11.13
shows CARS imaging results from rat mammary tissue, a model sys-
tem for human breast tissue. In combination with SHG imaging, the