
Page 365 - Vibrational Spectroscopic Imaging for Biomedical Applications
P. 365
T issue Imaging with CARS Micr oscopy 339
(a) (b) (c)
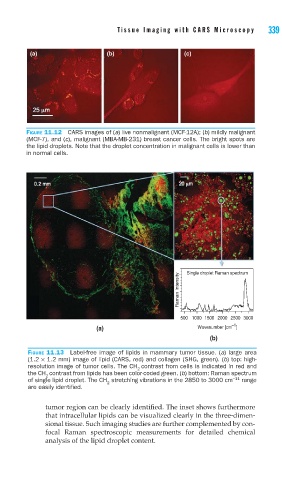
FIGURE 11.12 CARS images of (a) live nonmalignant (MCF-12A); (b) mildly malignant
(MCF-7), and (c), malignant (MBA-MB-231) breast cancer cells. The bright spots are
the lipid droplets. Note that the droplet concentration in malignant cells is lower than
in normal cells.
Raman Intensity Single droplet Raman spectrum
500 1000 1500 2000 2500 3000
–1
(a) Wavenumber [cm ]
(b)
FIGURE 11.13 Label-free image of lipids in mammary tumor tissue. (a) large area
(1.2 × 1.2 mm) image of lipid (CARS, red) and collagen (SHG, green). (b) top: high-
resolution image of tumor cells. The CH contrast from cells is indicated in red and
2
the CH contrast from lipids has been color-coded green. (b) bottom: Raman spectrum
2
of single lipid droplet. The CH stretching vibrations in the 2850 to 3000 cm −11 range
2
are easily identifi ed.
tumor region can be clearly identified. The inset shows furthermore
that intracellular lipids can be visualized clearly in the three-dimen-
sional tissue. Such imaging studies are further complemented by con-
focal Raman spectroscopic measurements for detailed chemical
analysis of the lipid droplet content.