
Page 245 - Water Engineering Hydraulics, Distribution and Treatment
P. 245
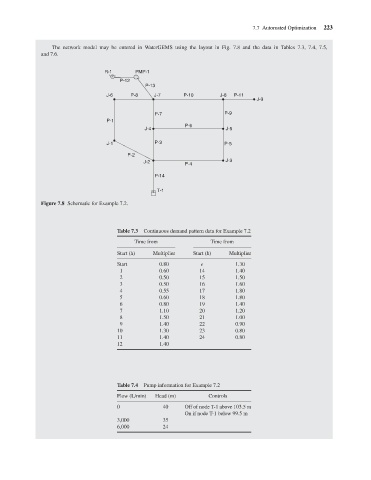
The network model may be entered in WaterGEMS using the layout in Fig. 7.8 and the data in Tables 7.3, 7.4, 7.5,
                                      and 7.6.
                                                                     PMP-1
                                                           R-1
                                                                P-12
                                                                        P-13
                                                                   P-8
                                                                                     P-10
                                                                           J-7
                                                           J-6
                                                                                                             J-9
                                                                           P-7
                                                           P-1
                                                                                     P-6         J-8 P-9  P-11  7.7 Automated Optimization  223
                                                                        J-4                        J-5
                                                           J-1             P-3                    P-5
                                                                  P-2
                                                                        J-2                        J-3
                                                                                     P-4
                                                                           P-14
                                                                            T-1
                                      Figure 7.8 Schematic for Example 7.2.
                                                               Table 7.3  Continuous demand pattern data for Example 7.2
                                                                     Time from                Time from

                                                               Start (h)   Multiplier   Start (h)   Multiplier
                                                               Start         0.80         e           1.30
                                                                1            0.60         14          1.40
                                                                2            0.50         15          1.50
                                                                3            0.50         16          1.60
                                                                4            0.55         17          1.80
                                                                5            0.60         18          1.80
                                                                6            0.80         19          1.40
                                                                7            1.10         20          1.20
                                                                8            1.50         21          1.00
                                                                9            1.40         22          0.90
                                                               10            1.30         23          0.80
                                                               11            1.40         24          0.80
                                                               12            1.40


                                                               Table 7.4  Pump information for Example 7.2
                                                               Flow (L/min)  Head (m)        Controls
                                                               0              40     Off of node T-1 above 103.5 m
                                                                                     On if node T-1 below 99.5 m
                                                               3,000          35
                                                               6,000          24