
Page 246 - Water Engineering Hydraulics, Distribution and Treatment
P. 246
224
Water Distribution Systems: Modeling and Computer Applications
Chapter 7
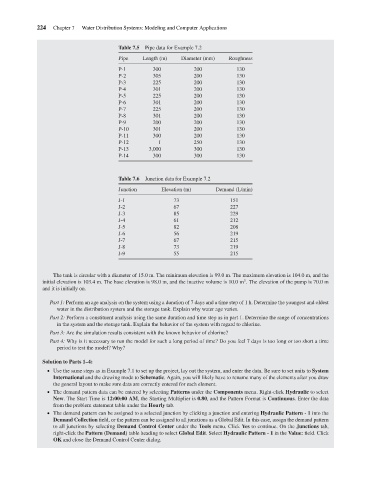
Table 7.5
Pipe data for Example 7.2
Pipe
130
300
200
P-1
200
P-2
130
305
200
P-3
225
130
301
P-4
130
200
P-5
200
130
225
301
P-6
130
200
130
P-7
225
200
P-8
200
130
301
200
130
200
P-9 Length (m) Diameter (mm) Roughness
P-10 301 200 130
P-11 300 200 130
P-12 1 250 130
P-13 3,000 300 130
P-14 300 300 130
Table 7.6 Junction data for Example 7.2
Junction Elevation (m) Demand (L/min)
J-1 73 151
J-2 67 227
J-3 85 229
J-4 61 212
J-5 82 208
J-6 56 219
J-7 67 215
J-8 73 219
J-9 55 215
The tank is circular with a diameter of 15.0 m. The minimum elevation is 99.0 m. The maximum elevation is 104.0 m, and the
3
initial elevation is 103.4 m. The base elevation is 98.0 m, and the inactive volume is 10.0 m . The elevation of the pump is 70.0 m
and it is initially on.
Part 1: Perform an age analysis on the system using a duration of 7 days and a time step of 1 h. Determine the youngest and oldest
water in the distribution system and the storage tank. Explain why water age varies.
Part 2: Perform a constituent analysis using the same duration and time step as in part 1. Determine the range of concentrations
in the system and the storage tank. Explain the behavior of the system with regard to chlorine.
Part 3: Are the simulation results consistent with the known behavior of chlorine?
Part 4: Why is it necessary to run the model for such a long period of time? Do you feel 7 days is too long or too short a time
period to test the model? Why?
Solution to Parts 1–4:
Use the same steps as in Example 7.1 to set up the project, lay out the system, and enter the data. Be sure to set units to System
International and the drawing mode to Schematic. Again, you will likely have to rename many of the elements after you draw
the general layout to make sure data are correctly entered for each element.
The demand pattern data can be entered by selecting Patterns under the Components menu. Right-click Hydraulic to select
New. The Start Time is 12:00:00 AM, the Starting Multiplier is 0.80, and the Pattern Format is Continuous. Enter the data
from the problem statement table under the Hourly tab.
The demand pattern can be assigned to a selected junction by clicking a junction and entering Hydraulic Pattern - 1 into the
Demand Collection field, or the pattern can be assigned to all junctions as a Global Edit. In this case, assign the demand pattern
to all junctions by selecting Demand Control Center under the Tools menu. Click Yes to continue. On the Junctions tab,
right-click the Pattern (Demand) table heading to select Global Edit. Select Hydraulic Pattern - 1 in the Value: field. Click
OK and close the Demand Control Center dialog.