
Page 247 - Water Engineering Hydraulics, Distribution and Treatment
P. 247
225
7.7 Automated Optimization
Base Scenario
Run the model for a 24-h period by selecting the Calculation Options under the Analysis menu. Double-click the Base
Calculation Options, then in the Time Analysis Type select EPS.The Duration (hours) is 24handthe Hydraulic Time Step
(hours) is 1.0 h. Close the Base Calculation Options dialog.
At the bottom of the Calculation Options window are more tabs. Click on the Scenarios tab. Notice that the Compute button is
in the Scenario window toolbar. Click the Compute button. WaterGEMS calculates the system parameters for a 24-h simulation
period. Details of the calculation can be viewed on the Calculation Summary window. Close the Calculation Summary and
Scenarios windows.
Click on the tank, then the Graphs button in the main toolbar. Create a Line-Series Graph from the New button in the Graphs
dialog. Select the Percent Full box under “Results” under the Fields field in the Graph Series Options window. Close the
Graph Series Options window. Size the Graph window to fit on the layout screen such that you can see most of the layout and
the toolbar in the Graph window to click the Play button. Play the 24-h simulation by clicking the Play button in the Graph
window. The flow in the pipes is indicated by the arrows. Note that that there is no flow in pipes P-12 and P-13 when the pump
is not operating. The flow direction reverses in pipes P-1, P-2, P-3, P-4, P-5, P-7, P-8, P-9, and P-14 over the 24-h period. The
volume of the water in tank T-1 is indicated by the Percent Full (%)onthe y-axis of the graph.
Age Analysis
The analysis of the age of water within the network may be performed by defining and running an age analysis scenario. From
the Analysis menu, select Scenarios.
Create a new Base Scenario by clicking the New button. Enter “Age Analysis” as the name of the scenario.
Clickonthe Calculation Options tab at the bottom of the window. Create a new Calculation Option by clicking the New button
and enter “Age Analysis Calculation Options” as the name. Double-click the calculation options you just created and select Age
in the Calculation Type field. The Duration is 168 h (7 days), and the Hydraulic Time Step is 1.00 h.
Go back to the Scenarios tab, right-click the Age Analysis scenario, and select Make Current. The red check should now be
on the Age Analysis scenario. Double-click on the Age Analysis scenario and select the Age Analysis Calculation Options in
the Calculation Options field.
Go back to the Scenarios tab and click the Compute button.
Close the Calculation Summary window and Scenarios dialog to view the layout screen.
Results
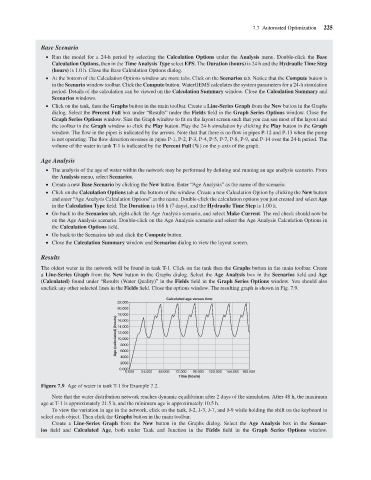
The oldest water in the network will be found in tank T-1. Click on the tank then the Graphs button in the main toolbar. Create
a Line-Series Graph from the New button in the Graphs dialog. Select the Age Analysis box in the Scenarios field and Age
(Calculated) found under “Results (Water Quality)” in the Fields field in the Graph Series Options window. You should also
unclick any other selected lines in the Fields field. Close the options window. The resulting graph is shown in Fig. 7.9.
Calculated age versus time
22,000
20,000
18,000
Age (calculated) (hours) 14,000
16,000
12,000
10,000
8000
6000
4000
2000
0.000
0.000 24.000 48.000 72.000 96.000 120.000 144.000 168.000
Time (hours)
Figure 7.9 Age of water in tank T-1 for Example 7.2.
Note that the water distribution network reaches dynamic equilibrium after 2 days of the simulation. After 48 h, the maximum
age at T-1 is approximately 21.5 h, and the minimum age is approximately 10.5 h.
To view the variation in age in the network, click on the tank, J-2, J-3, J-7, and J-9 while holding the shift on the keyboard to
select each object. Then click the Graphs button in the main toolbar.
Create a Line-Series Graph from the New button in the Graphs dialog. Select the Age Analysis box in the Scenar-
ios field and Calculated Age, both under Tank and Junction in the Fields field in the Graph Series Options window.