
Page 347 - Characterization and Properties of Petroleum Fractions - M.R. Riazi
P. 347
QC: IML/FFX
P2: IML/FFX
T1: IML
P1: IML/FFX
June 22, 2007
17:40
AT029-Manual-v7.cls
AT029-07
AT029-Manual
7. APPLICATIONS: ESTIMATION OF THERMOPHYSICAL PROPERTIES 327
In general when model parameters are tuned with available
experimental data especially for complex mixtures and heavy Constant Press. & Comp.
fractions, accuracy of model prediction for the given systems
can be greatly improved. A summary of some recommended
methods for different physical and thermodynamic proper-
Enthalpy
ties is given in Table 7.14.
7.6 PROBLEMS
7.1. For storage of light hydrocarbons and their mixtures in
sealed tanks, always a mixture of liquid and vapor are
stored. Why is this practiced, rather than storing 100% Temperature
gas or 100% liquid phase?
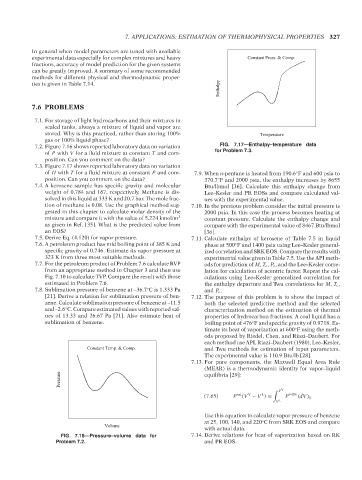
7.2. Figure 7.16 shows reported laboratory data on variation FIG. 7.17—Enthalpy–temperature data
of P with V for a fluid mixture at constant T and com- for Problem 7.3.
position. Can you comment on the data?
7.3. Figure 7.17 shows reported laboratory data on variation
of H with T for a fluid mixture at constant P and com- 7.9. When n-pentane is heated from 190.6 F and 600 psia to
◦
position. Can you comment on the data? 370.7 F and 2000 psia, the enthalpy increases by 8655
◦
7.4. A kerosene sample has specific gravity and molecular Btu/lbmol [36]. Calculate this enthalpy change from
weight of 0.784 and 167, respectively. Methane is dis- Lee–Kesler and PR EOSs and compare calculated val-
solved in this liquid at 333 K and 20.7 bar. The mole frac- ues with the experimental value.
tion of methane is 0.08. Use the graphical method sug- 7.10. In the previous problem consider the initial pressure is
gested in this chapter to calculate molar density of the 2000 psia. In this case the process becomes heating at
mixture and compare it with the value of 5.224 kmol/m 3 constant pressure. Calculate the enthalpy change and
as given in Ref. [35]. What is the predicted value from compare with the experimental value of 8467 Btu/lbmol
an EOS? [36].
7.5. Derive Eq. (4.120) for vapor pressure. 7.11. Calculate enthalpy of kerosene of Table 7.5 in liquid
7.6. A petroleum product has mid boiling point of 385 K and phase at 500 F and 1400 psia using Lee–Kesler general-
◦
specific gravity of 0.746. Estimate its vapor pressure at ized correlation and SRK EOS. Compare the results with
323 K from three most suitable methods. experimental value given in Table 7.5. Use the API meth-
7.7. For the petroleum product of Problem 7.6 calculate RVP ods for prediction of M, T c , P c , and the Lee–Kesler corre-
from an appropriate method in Chapter 3 and then use lation for calculation of acentric factor. Repeat the cal-
Fig. 7.10 to calculate TVP. Compare the result with those culations using Lee–Kesler generalized correlation for
estimated in Problem 7.6. the enthalpy departure and Twu correlations for M, T c ,
7.8. Sublimation pressure of benzene at –36.7 C is 1.333 Pa and P c .
◦
[21]. Derive a relation for sublimation pressure of ben- 7.12. The purpose of this problem is to show the impact of
zene. Calculate sublimation pressure of benzene at –11.5 both the selected predictive method and the selected
and –2.6 C. Compare estimated values with reported val- characterization method on the estimation of thermal
◦
ues of 13.33 and 26.67 Pa [21]. Also estimate heat of properties of hydrocarbon fractions. A coal liquid has a
sublimation of benzene. boiling point of 476 F and specific gravity of 0.9718. Es-
◦
timate its heat of vaporization at 600 F using the meth-
◦
ods proposed by Riedel, Chen, and Riazi–Daubert. For
each method use API, Riazi–Daubert (1980), Lee–Kesler,
Constant Temp. & Comp. and Twu methods for estimation of input parameters.
The experimental value is 110.9 Btu/lb [28].
7.13. For pure components, the Maxwell Equal Area Rule
(MEAR) is a thermodynamic identity for vapor–liquid
Pressure equilibria [29]:
V V
V
L
(7.65) P sat (V − V ) = P EOS (dV) T
V L
Use this equation to calculate vapor pressure of benzene
at 25, 100, 140, and 220 C from SRK EOS and compare
◦
Volume
with actual data.
FIG. 7.16—Pressure–volume data for 7.14. Derive relations for heat of vaporization based on RK
Problem 7.2. and PR EOS.
--`,```,`,``````,`,````,```,,-`-`,,`,,`,`,,`---
Copyright ASTM International
Provided by IHS Markit under license with ASTM Licensee=International Dealers Demo/2222333001, User=Anggiansah, Erick
No reproduction or networking permitted without license from IHS Not for Resale, 08/26/2021 21:56:35 MDT