
Page 355 - Adsorbents fundamentals and applications
P. 355
340 SORBENTS FOR APPLICATIONS
1.6
1.4 Nitrogen
Amount adsorbed (m mol/g) 0.8
1.2
Methane
1
0.6
0.4
0.2 Mg-clinoptilolite
0
0 1 2 3 4 5 6 7
Pressure (atm)
◦
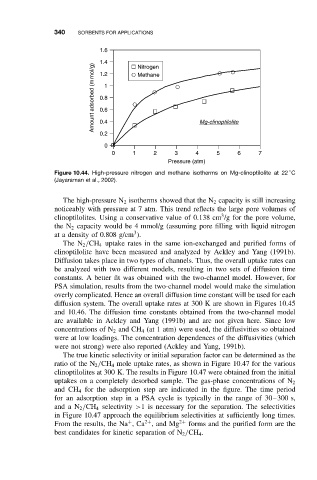
Figure 10.44. High-pressure nitrogen and methane isotherms on Mg-clinoptilolite at 22 C
(Jayaraman et al., 2002).
The high-pressure N 2 isotherms showed that the N 2 capacity is still increasing
noticeably with pressure at 7 atm. This trend reflects the large pore volumes of
3
clinoptilolites. Using a conservative value of 0.138 cm /g for the pore volume,
the N 2 capacity would be 4 mmol/g (assuming pore filling with liquid nitrogen
3
at a density of 0.808 g/cm ).
The N 2 /CH 4 uptake rates in the same ion-exchanged and purified forms of
clinoptilolite have been measured and analyzed by Ackley and Yang (1991b).
Diffusion takes place in two types of channels. Thus, the overall uptake rates can
be analyzed with two different models, resulting in two sets of diffusion time
constants. A better fit was obtained with the two-channel model. However, for
PSA simulation, results from the two-channel model would make the simulation
overly complicated. Hence an overall diffusion time constant will be used for each
diffusion system. The overall uptake rates at 300 K are shown in Figures 10.45
and 10.46. The diffusion time constants obtained from the two-channel model
are available in Ackley and Yang (1991b) and are not given here. Since low
concentrations of N 2 and CH 4 (at 1 atm) were used, the diffusivities so obtained
were at low loadings. The concentration dependences of the diffusivities (which
were not strong) were also reported (Ackley and Yang, 1991b).
The true kinetic selectivity or initial separation factor can be determined as the
ratio of the N 2 /CH 4 mole uptake rates, as shown in Figure 10.47 for the various
clinoptilolites at 300 K. The results in Figure 10.47 were obtained from the initial
uptakes on a completely desorbed sample. The gas-phase concentrations of N 2
and CH 4 for the adsorption step are indicated in the figure. The time period
for an adsorption step in a PSA cycle is typically in the range of 30–300 s,
and a N 2 /CH 4 selectivity >1 is necessary for the separation. The selectivities
in Figure 10.47 approach the equilibrium selectivities at sufficiently long times.
2+
+
From the results, the Na ,Ca ,and Mg 2+ forms and the purified form are the
best candidates for kinetic separation of N 2 /CH 4 .