
Page 113 - Advanced Organic Chemistry Part A - Structure and Mechanisms, 5th ed (2007) - Carey _ Sundberg
P. 113
92 Topic 1.4. Representation of Electron Density by the Laplacian
Function
CHAPTER 1
Chemical Bonding
and Molecular Structure Electron distribution in molecules can be usefully represented by the Laplacian
of the electron density. The Laplacian is defined by the equation
2
2
2
* * *
2
! = + + (1.30)
*x 2 *y 2 *z 2
2
which is a measure of the curvature of the electron density. The negative of ! , called
L, depicts regions of electron concentration as maxima and regions of electron depletion
as minima. The Laplacian function can distinguish these regions more easily than the
total electron density contours. It also depicts the concentric shells corresponding to the
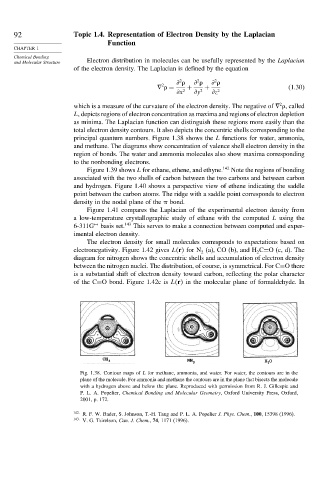
principal quantum numbers. Figure 1.38 shows the L functions for water, ammonia,
and methane. The diagrams show concentration of valence shell electron density in the
region of bonds. The water and ammonia molecules also show maxima corresponding
to the nonbonding electrons.
Figure 1.39 shows L for ethane, ethene, and ethyne. 142 Note the regions of bonding
associated with the two shells of carbon between the two carbons and between carbon
and hydrogen. Figure 1.40 shows a perspective view of ethene indicating the saddle
point between the carbon atoms. The ridge with a saddle point corresponds to electron
density in the nodal plane of the bond.
Figure 1.41 compares the Laplacian of the experimental electron density from
a low-temperature crystallographic study of ethane with the computed L using the
6-311G ∗∗ basis set. 143 This serves to make a connection between computed and exper-
imental electron density.
The electron density for small molecules corresponds to expectations based on
electronegativity. Figure 1.42 gives L r for N (a), CO (b), and H C=O (c, d). The
2
2
diagram for nitrogen shows the concentric shells and accumulation of electron density
between the nitrogen nuclei. The distribution, of course, is symmetrical. For C≡O there
is a substantial shift of electron density toward carbon, reflecting the polar character
of the C≡O bond. Figure 1.42c is L r in the molecular plane of formaldehyde. In
Fig. 1.38. Contour maps of L for methane, ammonia, and water. For water, the contours are in the
plane of the molecule. For ammonia and methane the contours are in the plane that bisects the molecule
with a hydrogen above and below the plane. Reproduced with permission from R. J. Gillespie and
P. L. A. Popelier, Chemical Bonding and Molecular Geometry, Oxford University Press, Oxford,
2001, p. 172.
142 R. F. W. Bader, S. Johnson, T.-H. Tang and P. L. A. Popelier J. Phys. Chem., 100, 15398 (1996).
143
V. G. Tsirelson, Can. J. Chem., 74, 1171 (1996).