
Page 489 - Automotive Engineering Powertrain Chassis System and Vehicle Body
P. 489
Modelling and assembly of the full vehicle C HAPTER 15.1
SINGLE WHEEL MODEL
Vehicle speed and wheel speed radius (kph) 80.0
100.0
60.0
40.0
20.0
0.0
20.0
0.0 1.0 2.0 3.0 4.0
Time (s)
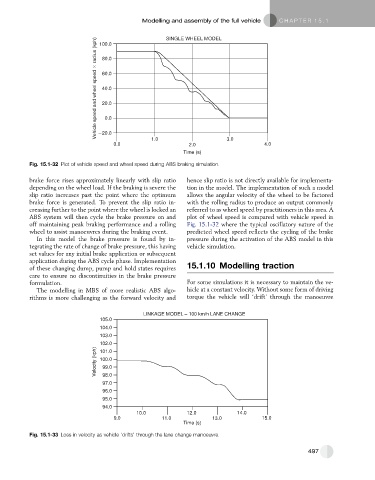
Fig. 15.1-32 Plot of vehicle speed and wheel speed during ABS braking simulation.
brake force rises approximately linearly with slip ratio hence slip ratio is not directly available for implementa-
depending on the wheel load. If the braking is severe the tion in the model. The implementation of such a model
slip ratio increases past the point where the optimum allows the angular velocity of the wheel to be factored
brake force is generated. To prevent the slip ratio in- with the rolling radius to produce an output commonly
creasing further to the point where the wheel is locked an referred to as wheel speed by practitioners in this area. A
ABS system will then cycle the brake pressure on and plot of wheel speed is compared with vehicle speed in
off maintaining peak braking performance and a rolling Fig. 15.1-32 where the typical oscillatory nature of the
wheel to assist manoeuvres during the braking event. predicted wheel speed reflects the cycling of the brake
In this model the brake pressure is found by in- pressure during the activation of the ABS model in this
tegrating the rate of change of brake pressure, this having vehicle simulation.
set values for any initial brake application or subsequent
application during the ABS cycle phase. Implementation
of these changing dump, pump and hold states requires 15.1.10 Modelling traction
care to ensure no discontinuities in the brake pressure
formulation. For some simulations it is necessary to maintain the ve-
The modelling in MBS of more realistic ABS algo- hicle at a constant velocity. Without some form of driving
rithms is more challenging as the forward velocity and torque the vehicle will ‘drift’ through the manoeuvre
LINKAGE MODEL – 100 km/h LANE CHANGE
105.0
104.0
103.0
102.0
Velocity (kph) 100.0
101.0
99.0
98.0
97.0
96.0
95.0
94.0
10.0 12.0 14.0
9.0 11.0 13.0 15.0
Time (s)
Fig. 15.1-33 Loss in velocity as vehicle ‘drifts’ through the lane change manoeuvre.
497