
Page 351 - Cascade_Biocatalysis_Integrating_Stereoselective_and_Environmentally_Friendly_Reactions
P. 351
15.2 Cascade Reactions for Assaying Transketolase Activity In Vitro 327
Using phenol red as a sensitive pH indicator in the presence of low buffer
concentration (2 mM triethanolamine (TEA), pH 7.5), an assay has been developed
for the reliable colorimetric determination of TK activity. This new continuous,
generic pH-based method proved suitable for the quantitative determination of
kinetic parameters, for individual substrates, for the rapid mapping of an enzyme’s
substrate tolerance, as well as for the HTS of TK variants.
Using this assay, the substrate specificities of the TK enzymes from E. coli and S.
cerevisiae, as well as two active site modified variants (D469E, H26Y) of E. coli TK
were evaluated against a panel of natural and nonnatural substrate analogs, such
as hydroxylated and nonhydroxylated, nonphosphorylated acceptor substrates, for
which specific activities and kinetic constants were determined.
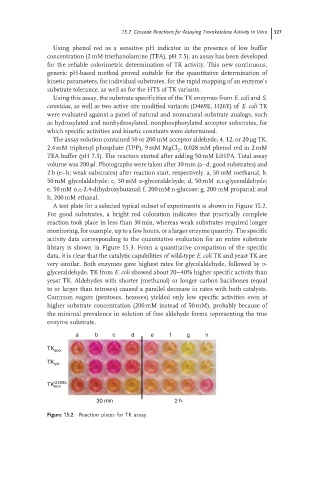
The assay solution contained 50 or 200 mM acceptor aldehyde, 4, 12, or 20 μgTK,
2.4 mM triphenyl phosphate (TPP), 9 mM MgCl , 0.028 mM phenol red in 2 mM
2
TEA buffer (pH 7.5). The reaction started after adding 50 mM LiHPA. Total assay
volume was 200 μl. Photographs were taken after 30 min (a–d; good substrates) and
2 h (e–h; weak substrates) after reaction start, respectively. a, 50 mM methanal; b,
50 mM glycolaldehyde; c, 50 mM d-glyceraldehyde; d, 50 mM d,l-glyceraldehyde;
e, 50 mM d,l-2,4-dihydroxybutanal; f, 200 mM d-glucose; g, 200 mM propanal; and
h, 200 mM ethanal.
A test plate for a selected typical subset of experiments is shown in Figure 15.2.
For good substrates, a bright red coloration indicates that practically complete
reaction took place in less than 30 min, whereas weak substrates required longer
monitoring, for example, up to a few hours, or a larger enzyme quantity. The specific
activity data corresponding to the quantitative evaluation for an entire substrate
library is shown in Figure 15.3. From a quantitative comparison of the specific
data, it is clear that the catalytic capabilities of wild-type E. coli TK and yeast TK are
very similar. Both enzymes gave highest rates for glycolaldehyde, followed by d-
glyceraldehyde. TK from E. coli showed about 20–40% higher specific activity than
yeast TK. Aldehydes with shorter (methanal) or longer carbon backbones (equal
to or larger than tetroses) caused a parallel decrease in rates with both catalysts.
Common sugars (pentoses, hexoses) yielded only low specific activities even at
higher substrate concentration (200 mM instead of 50 mM), probably because of
the minimal prevalence in solution of free aldehyde forms representing the true
enzyme substrate.
a b c d e f g h
TK eco
TK yst
D469E
TK eco
30 min 2 h
Figure 15.2 Reaction plates for TK assay.