
Page 345 - Biomedical Engineering and Design Handbook Volume 2, Applications
P. 345
NUCLEAR MEDICINE IMAGING INSTRUMENTATION 323
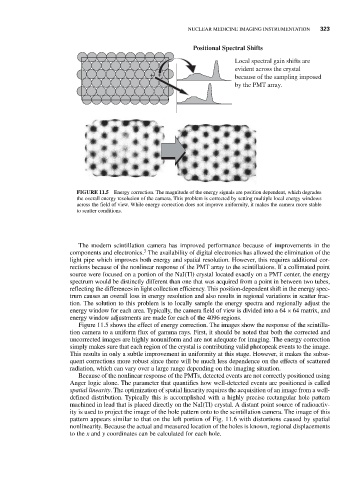
Positional Spectral Shifts
Local spectral gain shifts are
evident across the crystal
+ + because of the sampling imposed
by the PMT array.
FIGURE 11.5 Energy correction. The magnitude of the energy signals are position dependent, which degrades
the overall energy resolution of the camera. This problem is corrected by setting multiple local energy windows
across the field of view. While energy correction does not improve uniformity, it makes the camera more stable
to scatter conditions.
The modern scintillation camera has improved performance because of improvements in the
3
components and electronics. The availability of digital electronics has allowed the elimination of the
light pipe which improves both energy and spatial resolution. However, this requires additional cor-
rections because of the nonlinear response of the PMT array to the scintillations. If a collimated point
source were focused on a portion of the NaI(Tl) crystal located exactly on a PMT center, the energy
spectrum would be distinctly different than one that was acquired from a point in between two tubes,
reflecting the differences in light collection efficiency. This position-dependent shift in the energy spec-
trum causes an overall loss in energy resolution and also results in regional variations in scatter frac-
tion. The solution to this problem is to locally sample the energy spectra and regionally adjust the
energy window for each area. Typically, the camera field of view is divided into a 64 × 64 matrix, and
energy window adjustments are made for each of the 4096 regions.
Figure 11.5 shows the effect of energy correction. The images show the response of the scintilla-
tion camera to a uniform flux of gamma rays. First, it should be noted that both the corrected and
uncorrected images are highly nonuniform and are not adequate for imaging. The energy correction
simply makes sure that each region of the crystal is contributing valid photopeak events to the image.
This results in only a subtle improvement in uniformity at this stage. However, it makes the subse-
quent corrections more robust since there will be much less dependence on the effects of scattered
radiation, which can vary over a large range depending on the imaging situation.
Because of the nonlinear response of the PMTs, detected events are not correctly positioned using
Anger logic alone. The parameter that quantifies how well-detected events are positioned is called
spatial linearity. The optimization of spatial linearity requires the acquisition of an image from a well-
defined distribution. Typically this is accomplished with a highly precise rectangular hole pattern
machined in lead that is placed directly on the NaI(Tl) crystal. A distant point source of radioactiv-
ity is used to project the image of the hole pattern onto to the scintillation camera. The image of this
pattern appears similar to that on the left portion of Fig. 11.6 with distortions caused by spatial
nonlinearity. Because the actual and measured location of the holes is known, regional displacements
to the x and y coordinates can be calculated for each hole.