
Page 390 - Boiler_Operators_Handbook,_Second_Edition
P. 390
Controls 375
be left to proportional control. If, however, the process
responds sluggishly to a change in controller output
then the integral adjustment is more critical. Watching
what happens when you introduce an error will give
you a good idea of how to adjust the controller; a set-
point controller allows you to do just that.
When starting up a new system I adjust the con-
troller using some initial adjustments that are the aver-
age for comparable systems then switch it to automatic
to see what happens. Quick swings in the process vari-
able indicate instability and I would reduce gain im-
Figure 11-7. Controller error versus time, tuning guide
mediately if they happen. Then I sneak up the gain until
it starts getting a little unstable and back off some to
eliminate the instability. If the process doesn’t change five seconds to every minute. In that case any graphic
due to external influences I introduce an error to see you’re looking at can completely miss the swings you
what happens. Actually it’s much easier to work with an generated by changing the setpoint. Be very aware of
error you create because you can intentionally make it a that potential limit on electronic data.
value that you can relate to, something simple like 1% or When it comes to tuning controllers there is no
5% or 10%. substitute for practice to gain experience. If you decide
How do you create an error? You just change the to get some practice with a functioning controller you
setpoint, swinging it your selected difference from the should record the gain and integral adjustments before
process variable. If the process overshoots the setpoint you start changing them so you can restore the control-
considerably then reduce gain. If it seems to take forever ler to its original settings. If it doesn’t seem to work as
for the process to return to setpoint then increase inte- well when you’re done playing keep in mind that hys-
gral. If the process returns to setpoint while swinging teresis can have an effect so restore the original settings
back and forth either side of the setpoint then reduce by approaching them from the opposite direction.
integral. If the process slowly returns to setpoint then in- Hysteresis! Yup, another one of those fancy words.
crease integral until the process overshoots the setpoint It has to do with friction in mechanical systems but it can
a little once. occur in almost any situation. The best way I know of to
Changes in one adjustment normally require an explain hysteresis is to relate to the operation of a pneu-
opposite change in the other when you get close to the matic control valve without a positioner. The control
desired characteristic of the controller (that curve where valve in Figure 11-8 consists of a chamber over a rubber
the process overshoots setpoint once then swings in to diaphragm where the control pressure can push down
match it); an increase in gain will probably require a on the valve stem and a spring that pushes up to resist
decrease in reset and vice versa. the pressure forces. Without hysteresis the position of
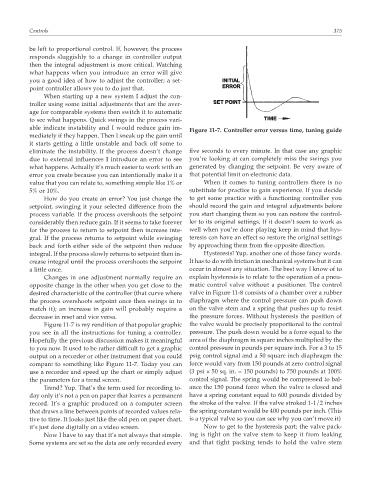
Figure 11-7 is my rendition of that popular graphic the valve would be precisely proportional to the control
you see in all the instructions for tuning a controller. pressure. The push down would be a force equal to the
Hopefully the previous discussion makes it meaningful area of the diaphragm in square inches multiplied by the
to you now. It used to be rather difficult to get a graphic control pressure in pounds per square inch. For a 3 to 15
output on a recorder or other instrument that you could psig control signal and a 50 square inch diaphragm the
compare to something like Figure 11-7. Today you can force would vary from 150 pounds at zero control signal
use a recorder and speed up the chart or simply adjust (3 psi × 50 sq. in. = 150 pounds) to 750 pounds at 100%
the parameters for a trend screen. control signal. The spring would be compressed to bal-
Trend? Yup. That’s the term used for recording to- ance the 150 pound force when the valve is closed and
day only it’s not a pen on paper that leaves a permanent have a spring constant equal to 600 pounds divided by
record. It’s a graphic produced on a computer screen the stroke of the valve. If the valve stroked 1-1/2 inches
that draws a line between points of recorded values rela- the spring constant would be 400 pounds per inch. (This
tive to time. It looks just like the old pen on paper chart, is a typical valve so you can see why you can’t move it)
it’s just done digitally on a video screen. Now to get to the hysteresis part; the valve pack-
Now I have to say that it’s not always that simple. ing is tight on the valve stem to keep it from leaking
Some systems are set so the data are only recorded every and that tight packing tends to hold the valve stem