
Page 395 - Boiler_Operators_Handbook,_Second_Edition
P. 395
380 Boiler Operator’s Handbook
resent the elements of a control system for a process and the Scientific Apparatus Manufacturer’s Association
how they are interconnected. Anything more elaborate (SAMA). The level transmitter (LT) produces the process
than a simple proportional control system will normally variable signal that is fed to the controller. The line to
have a diagram to show how the system is interconnect- the controller represents the level signal traveling from
ed and help you figure out how it works. Control sche- the transmitter to the controller by whatever means the
matics or diagrams are not the same as PID diagrams control system employs.
(see documentation). The PID shows the process itself The setpoint of the controller (desired water level)
and where the transmitters and control elements are in is produced at the controller and is represented by the
the process. capital letter A in the diamond on the side. That symbol
Control schematics show how the transmitters represents an analog output manually generated. The
and control elements are linked in a control system to K in the box implies proportional control (Engineers
control the process. The better control schematics will commonly use the letter K to represent a constant value
show the transmitters across the top of the drawing and and the gain of a proportional controller is a constant
the controlled elements (like valves and dampers) at the value that we multiply the error by) the funny looking
bottom so you have a flow from inputs to outputs going symbol after the plus sign is the integral symbol. I can
down the drawing. Lines on the drawing show the flow hear someone saying “WHY?” We’ve been talking about
of information and may or may not indicate how that PID and now he throws in K+∫, why? Because we engi-
information is transmitted. They may be process signals neers use those symbols on schematics to represent the
like 3 to 15 psig pneumatic or 4 to 20 milliamps of cur- functions to confuse other engineers and you—I’m kid-
rent but can also be digital or something as unique as ding, that’s not true, it’s a holdover from earlier works
light (as used in fiber-optics); it isn’t essential to know and you may run into it so I want you to know it. On
how the signal is transmitted to understand the system ISA drawings the collection of symbols in the center is
operation; only when you have to fix it. replaced by one circle with PID in it to represent the con-
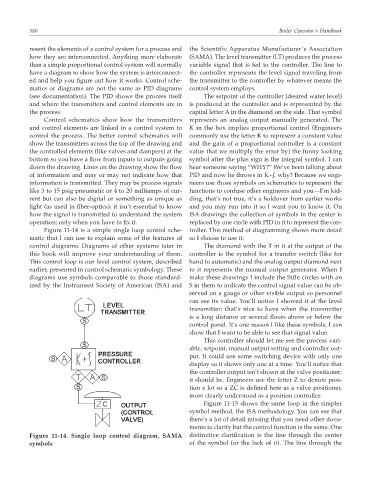
Figure 11-14 is a simple single loop control sche- troller. This method of diagramming shows more detail
matic that I can use to explain some of the features of so I choose to use it.
control diagrams. Diagrams of other systems later in The diamond with the T in it at the output of the
this book will improve your understanding of them. controller is the symbol for a transfer switch (like for
This control loop is our level control system, described hand to automatic) and the analog output diamond next
earlier, presented in control schematic symbology. These to it represents the manual output generator. When I
diagrams use symbols comparable to those standard- make these drawings I include the little circles with an
ized by the Instrument Society of American (ISA) and S in them to indicate the control signal value can be ob-
served on a gauge or other visible output so personnel
can see its value. You’ll notice I showed it at the level
transmitter; that’s nice to have when the transmitter
is a long distance or several floors above or below the
control panel. It’s one reason I like these symbols, I can
show that I want to be able to see that signal value.
This controller should let me see the process vari-
able, setpoint, manual output setting and controller out-
put. It could use some switching device with only one
display so it shows only one at a time. You’ll notice that
the controller output isn’t shown at the valve positioner;
it should be. Engineers use the letter Z to denote posi-
tion a lot so a ZC is defined here as a valve positioner,
more clearly understood as a position controller.
Figure 11-15 shows the same loop in the simpler
symbol method, the ISA methodology. You can see that
there’s a lot of detail missing that you need other docu-
ments to clarify but the control function is the same. One
Figure 11-14. Single loop control diagram, SAMA distinctive clarification is the line through the center
symbols of the symbol (or the lack of it). The line through the