
Page 72 - Circuit Analysis II with MATLAB Applications
P. 72
Chapter 2 Resonance
We will see later that
Z Resonant Frequency
0
Q = ------------------ = ------------------------------------------------------- (2.11)
Z – Z 1 Bandwidth
2
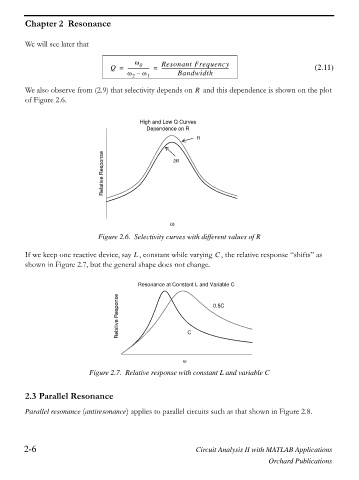
We also observe from (2.9) that selectivity depends on and this dependence is shown on the plot
R
of Figure 2.6.
High and Low Q Curves
Dependence on R
R
Relative Response 2R
Z
Figure 2.6. Selectivity curves with different values of R
If we keep one reactive device, say , constant while varying , the relative response “shifts” as
C
L
shown in Figure 2.7, but the general shape does not change.
Resonance at Constant L and Variable C
Relative Response C 0.5C
Z
Figure 2.7. Relative response with constant L and variable C
2.3 Parallel Resonance
Parallel resonance (antiresonance) applies to parallel circuits such as that shown in Figure 2.8.
2-6 Circuit Analysis II with MATLAB Applications
Orchard Publications