
Page 167 - Computational Statistics Handbook with MATLAB
P. 167
154 Computational Statistics Handbook with MATLAB
FI F U URE G 5.3 RE 5.3 1 1
IG
,,
(
F F II GU RE RE 5.3 1 1
5.3
GU
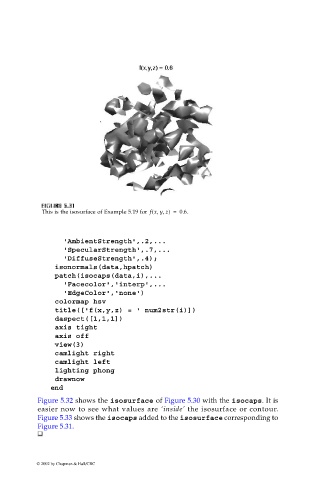
This is the isosurface of Example 5.19 for f xy z) = 0.6.
'AmbientStrength',.2,...
'SpecularStrength',.7,...
'DiffuseStrength',.4);
isonormals(data,hpatch)
patch(isocaps(data,i),...
'Facecolor','interp',...
'EdgeColor','none')
colormap hsv
title(['f(x,y,z) = ' num2str(i)])
daspect([1,1,1])
axis tight
axis off
view(3)
camlight right
camlight left
lighting phong
drawnow
end
Figure 5.32 shows the isosurface of Figure 5.30 with the isocaps. It is
easier now to see what values are ‘inside’ the isosurface or contour.
Figure 5.33 shows the isocaps added to the isosurface corresponding to
Figure 5.31.
© 2002 by Chapman & Hall/CRC