
Page 169 - Computational Statistics Handbook with MATLAB
P. 169
156 Computational Statistics Handbook with MATLAB
F FI U URE G 5.3 RE 5.3 3 3
IG
F F II GU RE RE 5.3 3 3
5.3
GU
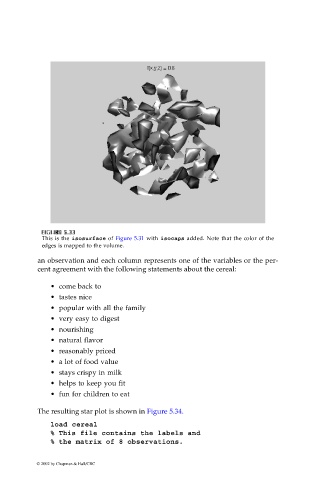
This is the isosurface of Figure 5.31 with isocaps added. Note that the color of the
edges is mapped to the volume.
an observation and each column represents one of the variables or the per-
cent agreement with the following statements about the cereal:
• come back to
• tastes nice
• popular with all the family
• very easy to digest
• nourishing
• natural flavor
• reasonably priced
• a lot of food value
• stays crispy in milk
• helps to keep you fit
• fun for children to eat
The resulting star plot is shown in Figure 5.34.
load cereal
% This file contains the labels and
% the matrix of 8 observations.
© 2002 by Chapman & Hall/CRC