Page 283 - Computational Statistics Handbook with MATLAB
P. 283

272                        Computational Statistics Handbook with MATLAB


                                axis([30 120 0 0.035])
                                xlabel('Waiting Time (minutes)')
                                ylabel('Probability Density Function')
                                title('Old Faithful-Waiting Times Between Eruptions')
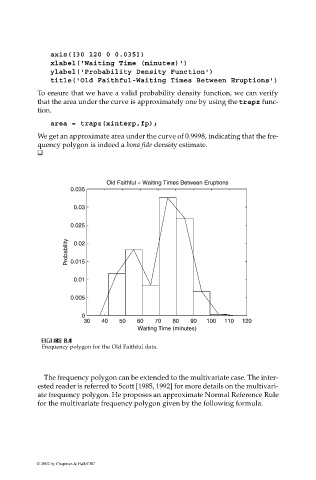
                             To ensure that we have a valid probability density function, we can verify
                             that the area under the curve is approximately one by using the trapz func-
                             tion.

                                area = trapz(xinterp,fp);
                             We get an approximate area under the curve of 0.9998, indicating that the fre-
                             quency polygon is indeed a bona fide density estimate.


                                                Old Faithful − Waiting Times Between Eruptions
                                      0.035


                                       0.03

                                      0.025
                                     Probability  0.015
                                       0.02


                                       0.01

                                      0.005

                                         0
                                          30  40   50   60   70   80   90   100  110  120
                                                         Waiting Time (minutes)

                               IG
                              F FI  U URE G 8.4  RE 8.4
                              F F II  GU  RE RE 8.4
                               GU
                                  8.4
                              Frequency polygon for the Old Faithful data.
                              The frequency polygon can be extended to the multivariate case. The inter-
                             ested reader is referred to Scott [1985, 1992] for more details on the multivari-
                             ate frequency polygon. He proposes an approximate Normal Reference Rule
                             for the multivariate frequency polygon given by the following formula.


                            © 2002 by Chapman & Hall/CRC
   278   279   280   281   282   283   284   285   286   287   288