
Page 292 - Computational Statistics Handbook with MATLAB
P. 292
Chapter 8: Probability Density Estimation 281
0.35
0.3
0.25
0.2
0.15
0.1
0.05
0
−4 −3 −2 −1 0 1 2 3 4
IG
FI F U URE G 8.8. RE 8.8.
GU
F F II GU RE RE 8.8. 8.8.
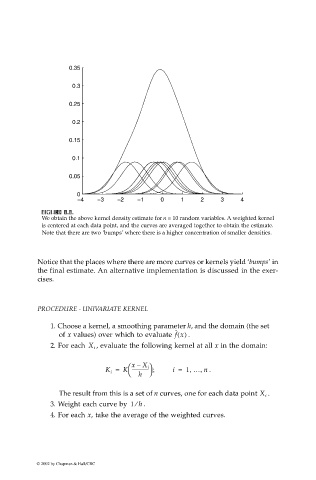
We obtain the above kernel density estimate for n = 10 random variables. A weighted kernel
is centered at each data point, and the curves are averaged together to obtain the estimate.
Note that there are two ‘bumps’ where there is a higher concentration of smaller densities.
Notice that the places where there are more curves or kernels yield ‘bumps’ in
the final estimate. An alternative implementation is discussed in the exer-
cises.
PROCEDURE - UNIVARIATE KERNEL
1. Choose a kernel, a smoothing parameter h, and the domain (the set
of x values) over which to evaluate f x() .
ˆ
, evaluate the following kernel at all x in the domain:
2. For each X i
x – X i
,
,
K i = K -------------- ; i = 1 … n .
h
.
The result from this is a set of n curves, one for each data point X i
3. Weight each curve by 1 h⁄ .
4. For each x, take the average of the weighted curves.
© 2002 by Chapman & Hall/CRC