
Page 284 - DSP Integrated Circuits
P. 284
6.10 Interpolator, Cont. 269
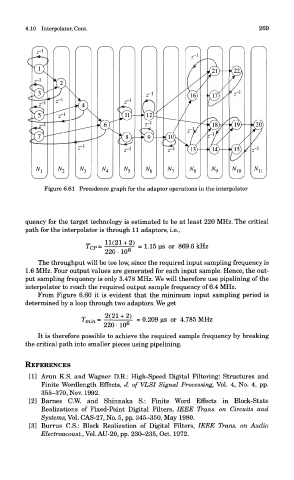
Figure 6.61 Precedence graph for the adaptor operations in the interpolator
quency for the target technology is estimated to be at least 220 MHz. The critical
path for the interpolator is through 11 adaptors, i.e.,
The throughput will be too low, since the required input sampling frequency is
1.6 MHz. Four output values are generated for each input sample. Hence, the out-
put sampling frequency is only 3.478 MHz. We will therefore use pipelining of the
interpolator to reach the required output sample frequency of 6.4 MHz.
From Figure 6.60 it is evident that the minimum input sampling period is
determined by a loop through two adaptors. We get
It is therefore possible to achieve the required sample frequency by breaking
the critical path into smaller pieces using pipelining.
REFERENCES
[11 Arun K.S. and Wagner D.R.: High-Speed Digital Filtering: Structures and
Finite Wordlength Effects, J. of VLSI Signal Processing, Vol. 4, No. 4, pp.
355-370, Nov. 1992.
[2] Barnes C.W. and Shinnaka S.: Finite Word Effects in Block-State
Realizations of Fixed-Point Digital Filters, IEEE Trans, on Circuits and
Systems, Vol. CAS-27, No. 5, pp. 345-350, May 1980.
[3] Burrus C.S.: Block Realization of Digital Filters, IEEE Trans, on Audio
Electroacoust., Vol. AU-20, pp. 230-235, Oct. 1972.