
Page 254 - Electrical Safety of Low Voltage Systems
P. 254
Testing the Electrical Safety 237
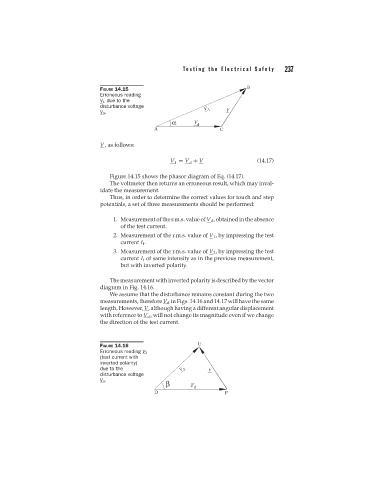
FIGURE 14.15
Erroneous reading
V 1 due to the
disturbance voltage
V d .
V, as follows:
V = V + V (14.17)
1 d
Figure 14.15 shows the phasor diagram of Eq. (14.17).
The voltmeter then returns an erroneous result, which may inval-
idate the measurement.
Thus, in order to determine the correct values for touch and step
potentials, a set of three measurements should be performed:
1. Measurement of the r.m.s. value of V d , obtained in the absence
of the test current.
2. Measurement of the r.m.s. value of V 1 , by impressing the test
current I t .
3. Measurement of the r.m.s. value of V 2 , by impressing the test
current I t of same intensity as in the previous measurement,
but with inverted polarity.
The measurement with inverted polarity is described by the vector
diagram in Fig. 14.16.
We assume that the disturbance remains constant during the two
measurements, therefore V d in Figs. 14.16 and 14.17 will have the same
length. However, V, although having a different angular displacement
with reference to V d , will not change its magnitude even if we change
the direction of the test current.
FIGURE 14.16
Erroneous reading V 2
(test current with
inverted polarity)
due to the
disturbance voltage
V d .