
Page 94 - T. Anderson-Fracture Mechanics - Fundamentals and Applns.-CRC (2005)
P. 94
1656_C02.fm Page 74 Thursday, April 14, 2005 6:28 PM
74 Fracture Mechanics: Fundamentals and Applications
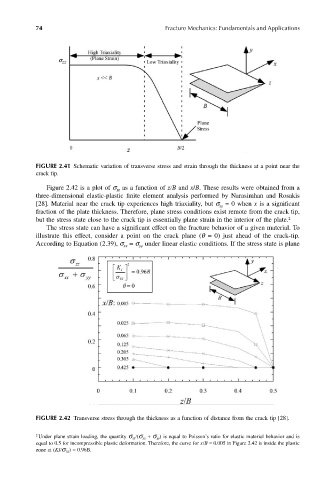
FIGURE 2.41 Schematic variation of transverse stress and strain through the thickness at a point near the
crack tip.
Figure 2.42 is a plot of σ as a function of z/B and x/B. These results were obtained from a
zz
three-dimensional elastic-plastic finite element analysis performed by Narasimhan and Rosakis
[28]. Material near the crack tip experiences high triaxiality, but σ = 0 when x is a significant
zz
fraction of the plate thickness. Therefore, plane stress conditions exist remote from the crack tip,
but the stress state close to the crack tip is essentially plane strain in the interior of the plate. 2
The stress state can have a significant effect on the fracture behavior of a given material. To
illustrate this effect, consider a point on the crack plane (θ = 0) just ahead of the crack-tip.
According to Equation (2.39), σ = σ under linear elastic conditions. If the stress state is plane
xx
yy
FIGURE 2.42 Transverse stress through the thickness as a function of distance from the crack tip [28].
2 Under plane strain loading, the quantity σ zz /(σ xx + σ yy ) is equal to Poisson’s ratio for elastic material behavior and is
equal to 0.5 for incompressible plastic deformation. Therefore, the curve for x/B = 0.005 in Figure 2.42 is inside the plastic
zone at (KI/σ YS ) = 0.96B.