
Page 97 - T. Anderson-Fracture Mechanics - Fundamentals and Applns.-CRC (2005)
P. 97
1656_C02.fm Page 77 Thursday, April 14, 2005 6:28 PM
Linear Elastic Fracture Mechanics 77
FIGURE 2.46 Fracture process zone at the tip of a
crack.
illustrates the fracture surface morphology for three specimen thicknesses. Fracture toughness tests
on very thin plates or sheets typically result in a 45° shear fracture. At larger thicknesses, there is
generally some mixture of shear fracture and flat fracture. The thickness effect on the apparent
fracture toughness is due to the relative portions of flat and shear fracture. In the limit of a very
thick specimen, the flat fracture mechanism dominates, and further increases in thickness have
relatively little effect on the measured toughness.
The stress distribution depicted in Figure 2.41 is characteristic of all section thicknesses. A
central plane strain region can exist even in thin sheet specimens, as long as the distance from the
crack-tip is sufficiently small. Pure slant fracture occurs when the distance over which high
triaxiality conditions exist is smaller than the fracture process zone, which is a function of micro-
structural parameters such as inclusion spacing. Figure 2.46 illustrates the concept of a fracture
process zone. The micromechanical processes that lead to ductile crack extensions occur over a
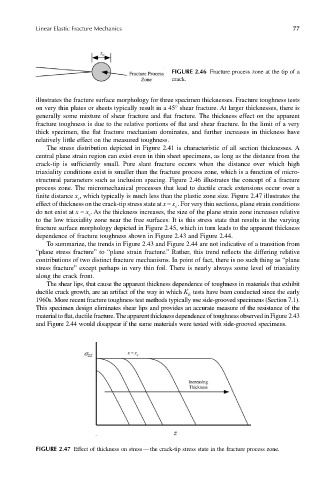
finite distance x , which typically is much less than the plastic zone size. Figure 2.47 illustrates the
c
effect of thickness on the crack-tip stress state at x = x . For very thin sections, plane strain conditions
c
do not exist at x = x . As the thickness increases, the size of the plane strain zone increases relative
c
to the low triaxiality zone near the free surfaces. It is this stress state that results in the varying
fracture surface morphology depicted in Figure 2.45, which in turn leads to the apparent thickness
dependence of fracture toughness shown in Figure 2.43 and Figure 2.44.
To summarize, the trends in Figure 2.43 and Figure 2.44 are not indicative of a transition from
“plane stress fracture” to “plane strain fracture.” Rather, this trend reflects the differing relative
contributions of two distinct fracture mechanisms. In point of fact, there is no such thing as “plane
stress fracture” except perhaps in very thin foil. There is nearly always some level of triaxiality
along the crack front.
The shear lips, that cause the apparent thickness dependence of toughness in materials that exhibit
ductile crack growth, are an artifact of the way in which K tests have been conducted since the early
Ic
1960s. More recent fracture toughness test methods typically use side-grooved specimens (Section 7.1).
This specimen design eliminates shear lips and provides an accurate measure of the resistance of the
material to flat, ductile fracture. The apparent thickness dependence of toughness observed in Figure 2.43
and Figure 2.44 would disappear if the same materials were tested with side-grooved specimens.
FIGURE 2.47 Effect of thickness on stress — the crack-tip stress state in the fracture process zone.