
Page 132 - Gas Purification 5E
P. 132
122 Gas PiiriJcation
through the column. In general, for C02 absorption, the bulge is sharper and lower in the col-
umn for primary amines, broader for secondary amines, and very broad for tertiary amines,
which absorb C02 quite slowly and also have a low heat of solution.
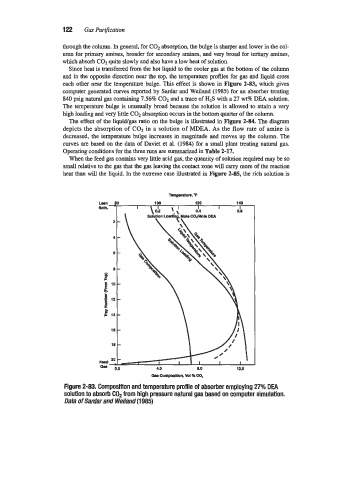
Since heat is transferred from the hot liquid to the cooler gas at the bottom of the column
and in the opposite direction near the top, the temperature profiles for gas and liquid cross
each other near the temperature bulge. This effect is shown in Figure 2-83, which gives
computer generated curves reported by Sardar and Weiland (1985) for an absorber treating
840 psig natural gas containing 7.56% C02 and a trace of H2S with a 27 wt% DEA solution.
The temperature bulge is unusually broad because the solution is allowed to attain a very
high loading and very little C02 absorption occurs in the bottom quarter of the column.
The effect of the liquidgas ratio on the bulge is illustrated in Figure 2-84. The diagram
depicts the absorption of C02 in a solution of MDEA. As the flow rate of amine is
decreased, the temperature bulge increases in magnitude and moves up the column. The
curves are based on the data of Daviet et al. (1984) for a small plant treating natural gas.
Operating conditions for the three runs are summarized in Table 2-17.
When the feed gas contains very little acid gas, the quantity of solution required may be so
small relative to the gas that the gas leaving the contact zone will carry more of the reaction
heat than will the liquid. In the extreme case illustrated in Figure 2-85, the rich solution is
12.0
Gas Comporilion, Vol K CO,
Figure 2-83. Composition and temperature profile of absorber employing 27% DEA
solution to absorb COP from high pressure natural gas based on computer simulation.
Data of Sardar and Weiland (1 985)