
Page 155 - Industrial Power Engineering and Applications Handbook
P. 155
Static controls and braking of motors 6/135
6.15.1 Illustration of energy conservation R Y B
In an industry there may be many drives that may not be
required to operate at their optimum capacity at all times.
The process requirement may require a varying utilization
of the capacity of the drive at different times. In an
induction motor, which is a constant speed prime-mover,
such a variation is conventionally achieved by throttling
the flow valves or by employing dampers.
There may be many types of the drives in an industry,
particularly when it is a process industry. The most
common drives are fan$, pumps, and compressors etc.,
Discharge -
employed for the various utilities. storage and process
activities of the plant. The plant may be chemical or a 0
petrochemical. water treatment or sewage disposal, paper
and pulp unit or even a crane or a hoist application. I
The method of speed or flow control by throttling, r
dampening (vane control) or braking, indirectly reduces
the capacity of the motor at the cost of high power loss
in the stator and slip loss in the rotor circuit, as discussed
above. These losses can now be eliminated with the
effective use of static control variable-speed drives or
fluid couplings. We will show, through the following
illustrations. the energy saving by using such controls.
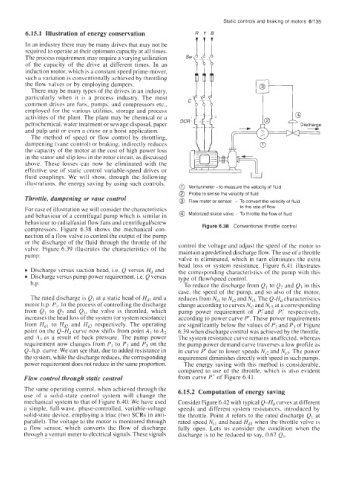
Venturimeter - to measure the velocity of fluid
Probe to sense the velocity of fluid
Throttle, dampening or vane control Flow meter or sensor - To convert the velocity of fluid
For ease of illustration we will consider the characteristics to the rate of flow
and behaviour of a centrifugal pump which is similar in Motorized sluice valve - To throttle the flow of fluid
behaviour to radialhxial flow fans and centrifugakrew
compressors. Figure 6.38 shows the mechanical con- Figure 6.38 Conventional throttle control
nection of a flow valve to control the output of the pump
or the discharge of the fluid through the throttle of the control the voltage and adjust the speed of the motor to
valve. Figure 6.39 illustrates the characteristics of the maintain a predefined discharge flow. The use ofa throttle
pump:
valve is eliminated, which in turn eliminates the extra
head loss or system resistance. Figure 6.41 illustrates
Dijcharge versus suction head, i.e. Q versus Hd and the corresponding characteristics of the pump with this
Discharge versus pump power requirement, Le. Q versus type of flowispeed control.
h.p. To reduce the discharge from Q, to Q2 and Q3 in this
case, the speed of the pump, and so also of the motor,
The rated discharge is Ql at a static head of Hdl and a reduces from N,, to Nr2 and Nr3. The Q-Hd characteristics
motor h.p. PI. In the process of controlling the discharge change according to curves Nrz and Nr3, at a corresponding
from Q, to Q2 and Q3, the valve is throttled, which pump power requirement of Py and P;l respectively.
inci-eases the head loss of the system (or system resistance) according to power curve P'. These power requirements
from Hdl to Hd, and Hd3 respectively. The operating are significantly below the values of P, and P, of Figure
point on the Q-Hd curve now shifts from point A, to A2 6.39 when discharge control was achieved by the throttle.
and A, as a result of back pressure. The pump power The system resistance curve remains unaffected, whereas
requirement now changes from PI to P, and P, on the the pump power demand curve traverses a low profile as
Q-h.p. curve. We can see that. due to added resistance in in curve P' due to lower speeds N,? and Nr3. The power
the system. while the discharge reduces, the corresponding requirement diminishes directly with speed in such pumps.
power requirement does not reduce in the same proportion. The energy saving with this method is considerable,
compared to use of the throttle. which is also evident
Flow control through static control from curve P' of Figure 6.4 1.
The same operating control. when achieved through the 6.15.2 Computation of energy saving
use of a solid-state control system will change the
mechanical system to that of Figure 6.40. We have used Consider Figure 6.42 with typical Q-HCI curves at different
a simple. full-wave, phase-controlled, variable-voltage speeds and different system resistances, introduced by
solid-state device, employing a triac (two SCRs in anti- the throttle. Point A refers to the rated discharge QI at
parallel). The voltage to the motor is monitored through rated speed N,, and head Hdl when the throttle valve ih
a flow sensor, which converts the flow of discharge fully open. Lets us consider the condition when the
through a venturi meter to electrical signals. These signals discharge is to be reduced to say, 0.67 QI.