
Page 156 - Industrial Power Engineering and Applications Handbook
P. 156
6/136 Industrial Power Engineering and Applications Handbook
Hd3
Hd2
v)c
t Hdl
P
P
9 curves
Discharge 'Q' -
0
Q3 Q2 QI
(a) Discharge versus suction head.
0
Q3 Q2 Q,
Discharge 'Q'-
(b) Discharge versus pump power.
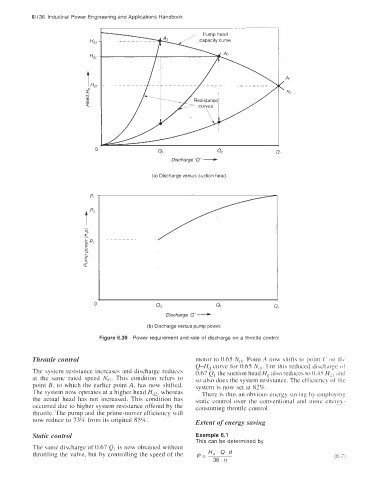
Figure 6.39 Power requirement and rate of discharge on a throttle control
Throttle control motor to 0.65 Nrl. Point A now shifts to point C on the
Q-Hd curve for 0.65 Nr,. For this reduced discharge of
The system resistance increases and discharge reduces 0.67 Q, the suction head Hd also reduces to 0.45 Hdl and
at the same rated speed Nrl. This condition refers to so also does the system resistance. The efficiency of the
point B, to which the earlier point A, has now shifted. system is now set at 82%.
The system now operates at a higher head Hd2, whereas There is thus an obvious energy saving by employing
the actual head has not increased. This condition has static control over the conventional and more energy-
occurred due to higher system resistance offered by the consuming throttle control.
throttle. The pump and the prime-mover efficiency will
now reduce to 73% from its original 85%. Extent of energy saving
Static control Example 6.1
This can be determined by
The same discharge of 0.67 Q, is now obtained without
throttling the valve, but by controlling the speed of the