
Page 459 - Industrial Power Engineering and Applications Handbook
P. 459
Testing of metal-enclosed switchgear assemblies 141433
value of the fault current of the first major loop, after 2 Test current IR = 39.6 kA
commencement of the fault condition at instant D1, is /y = 47.2 kA
indicated as ZM. Referring to the original oscillogram, /B = 41.2 kA
(Figure 14.4), it occurs in phase Z Highest of the above exists in phase Y at 47.2 kA
:. equivalent current rating of the equipment under test
Example 14.1 for
For more clarity we have reproduced in Figure 14.3 an actual 1 second = 47.2. J116
test circuit and in Figure 14.4, the oscillograms of the test
results of a short-circuit test successfully carried out on an
LT power distribution panel (Figure 14.8) for a system fault
level of 50 kAfor 1 second, at CPRl (Central Power Research
Institute). From a study of these oscillograms (Figure 14.4), = 47.2 x 1.077
we can infer the following test results:
= 50.836 kA
1 No. of completed test cycles = 58 3 The maximum peak current also appears in phase Yand
measures at 110.6 kA at the first loop of the current wave.
58
=
:. duration of test for a 50 Hz system = - 1.1 6 second This loop is 11 0.6/50, i.e. 2.21 times the test current and
50 satisfies the requirement of Table 13.11.
Analysis of the test results
As discussed above we establish two basic parameters
from a short-time withstand test, i.e.
1 Thermal capability of the equipment under test, Le.
I,, and its duration
2 Mechanical compatibility through the peak making
current, ZM, as in Table 13.1 1.
Before creating a fault condition, to obtain the required
Zsc the impedance of the test circuit is adjusted so that
the required fault current is obtained in all the phases on
creating a short-circuit. To provide the required thermal
effect (Z: . t), the duration of test, t, is then adjusted
accor-dingly. The relevant standards therefore stipulate
that the test current may be higher or lower than required
and can be compensated by adjusting its duration, t.
However, due to the minor variations in the phase
impedances, all the phases may not be subjected to
identical severity of faults. For instance, in the above
test each phase has recorded a different fault current. To
evaluate the fault level from these test data, the general
practice has been to consider the phase that has recorded
the highest fault current as the base, which may occur in
any of the phases. In the above test, it has occurred in
phaseY. For this fault current, the test duration is adjusted
to achieve the required severity of fault in terms of thermal
effect (502 x 1 in the above case).
Some userslconsultants, however, are of the opinion
that by this method the other phases are not subjected to
the same severity. Accordingly, they prefer to consider
the phase that is subjected to the least fault current as the
base. Accordingly, the test duration should be adjusted
for this phase. In the above case, the minimum severity
has occurred in phase R, with only 39.6 kA. According
to this philosophy the test duration should be enhanced to
502 or 1.59 s
(39.6)2
as against 1.16 s in the above test.
Even then it is essential, that the peak making current,
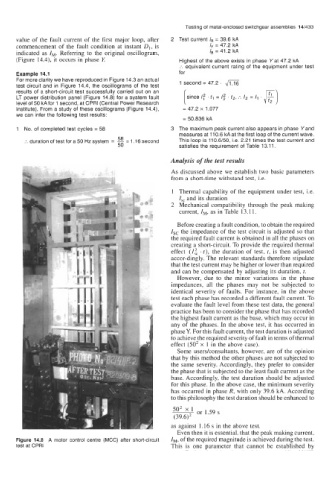
Figure 14.8 A motor control centre (MCC) after short-circuit ZM, of the required magnitude is achieved during the test.
test at CPRl This is one parameter that cannot be established by