
Page 79 - Industrial Power Engineering and Applications Handbook
P. 79
3/60 Industrial Power Engineering and Applications Handbook
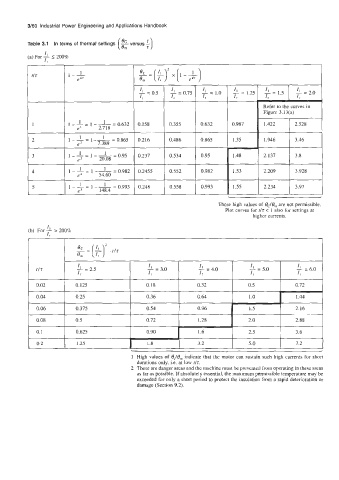
Table 3.1 In terms of thermal settings (z versus L)
I
5
(a) For l- 200%
I,
tlr 1-- 1
e
Refer to the curves in
Figure 3.13(a)
1
1 1 -- = 1 - 1 = 0.632 3.158 0.355 0.632 0.987 1.422 I 2.528 I
e' 2.718
2 0.865 r 0.486 0.865 1.35 1.946 I 3.46 1
3.216
L
7.389
3 3.237 1 0.534 1 0.95 1.48 2.137
4 3.2455 I 0.552 I 0.982 1.53 2.209 3.928
~~
I
5 1--=1-1- - 0.993 3.248 I 0.558 1 0.993 1.55 2.234
e5 148.4
These high values of e,/@,, are not permissible.
Plot curves for tlz < 1 also for settings at
higher currents.
I
(b) For 2 > 200%
I,
0.2 1.25
2
1 High values of 6,/8,,, indicate that the motor can sustain such high currents for short
durations only, i.e. at low tl7.
2 These are danger areas and the machine must be prevented from operating in these areas
as far as possible. If absolutely essential, the maximum permissible temperature may be
exceeded for only a short period to protect the insulation from a rapid deterioration or
damage (Section 9.2).