
Page 598 - Instrumentation Reference Book 3E
P. 598
580 Non-destructive testing
Synchronization
Pulse
generator
i
Oscilloscope
Y
Wide-band 2
amplifier . 1
Transducer 1
Eia Spectrum
Specimen analyzer
Figure 24.23 Pulse-echo spectroscope.
Barium titanate-5 MHz
Swept Sweep signal
frequency
generator
- Lead metanlobate-10 MHZ
intensification X
2
Y I Lithium sul~hate-15 MHZ
Osci I loscope
Specimen
Figure 24.24 Pulsedfrequency-modulation
spectroscope.
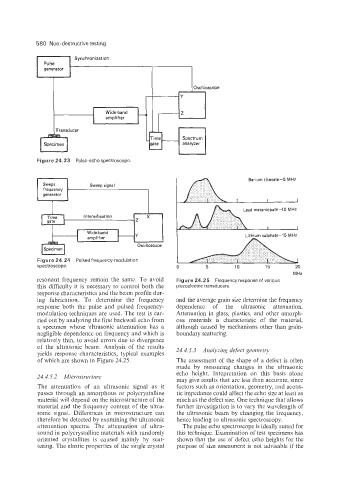
M Hz
resonant frequency remain the same. To avoid Figure 24.25 Frequencyresponseof various
this difficulty it is necessary to control both the piezoelectric transducers.
response characteristics and the beam profile dur-
ing fabrication. To determine the frequency and the average grain size determine the frequency
response both the pulse and pulsed frequency- dependence of the ultrasonic attenuation.
modulation techniques are used. The test is car- Attenuation in glass, plastics, and other amorph-
ried out by analyzing the first backwall echo from ous materials is characteristic of the material,
a specimen whose ultrasonic attenuation has a although caused by mechanisms other than grain-
negligible dependence on frequency and which is boundary scattering.
relatively thin, to avoid errors due to divergence
of the ultrasonic beam. Analysis of the results 24.4.5.3 Analyzing defect geometry
yields response characteristics, typical examples
of which are shown in Figure 24.25. The assessment of the shape of a defect is often
made by measuring changes in the ultrasonic
echo height. Intepretation on this basis alone
24.4.5.2 Microstructure
may give results that are less than accurate, since
The attenuation of an ultrasonic signal as it factors such as orientation, geometry, and acous-
passes through an amorphous or polycrystalline tic impedance could affect the echo size at least as
material will depend on the microstructure of the much as the defect size. One technique that allows
material and the frequency content of the ultra- further investigation is to vary the wavelength of
sonic signal. Differences in microstructure can the ultrasonic beam by changing the frequency,
therefore be detected by examining the ultrasonic hence leading to ultrasonic spectroscopy.
attenuation spectra. The attenuation of ultra- The pulse echo spectroscope is ideally suited for
sound in polycrystalline materials with randomly this technique. Examination of test specimens has
oriented crystallites is caused mainly by scat- shown that the use of defect echo heights for the
tering. The elastic properties of the single crystal purpose of size assessment is not advisable if the