
Page 596 - Instrumentation Reference Book 3E
P. 596
578 Non-destructive testing
Connector
xConnector
Absorber
1 Perspex shoe I co
,/ Shear
Compression probe I
Shear probe
Transmitter
crystal
Absorber /
Receiver
t crystal
Cork shin
Compression probe Shear probe: pian view
(b)
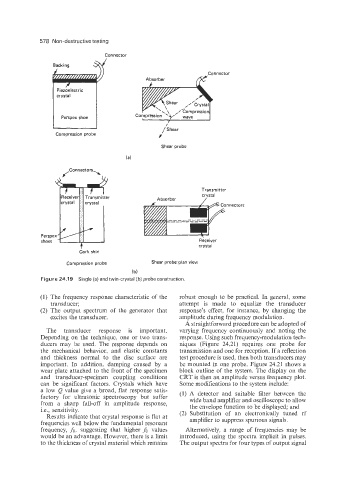
Figure 24.19 Single (a) and twin-crystal (b) probe construction.
(1) The frequency response characteristic of the robust enough to be practical. In general, some
transducer; attempt is made to equalize the transducer
(2) The output spectrum of the generator that response’s effect, for instance, by changing the
excites the transducer. amplitude during frequency modulation.
A straightforward procedure can be adopted of
The transducer response is important. varying frequency continuously and noting the
Depending on the technique, one or two trans- response. Using such frequency-modulation tech-
ducers may be used. The response depends on niques (Figure 24.21) requires one probe for
the mechanical behavior, and elastic constants transmission and one for reception. If a reflection
and thickness normal to the disc surface are test procedure is used, then both transducers may
important. In addition, damping caused by a be mounted in one probe. Figure 24.21 shows a
wear plate attached to the front of the specimen block outline of the system. The display on the
and transducer-specimen coupling conditions CRT is then an amplitude versus frequency plot.
can be significant factors. Crystals which have Some modifications to the system include:
a low Q value give a broad, flat response satis-
factory for ultrasonic spectroscopy but suffer (1) A detector and suitable filter between the
from a sharp fall-off in amplitude response, wide band amplifier and oscilloscope to allow
the envelope function to be displayed; and
i.e., sensitivity.
Results indicate that crystal response is flat at (2) Substitution of an electronically tuned rf
frequencies well below the fundamental resonant amplifier to suppress spurious signals.
frequency, fo, suggesting that higher fo values Alternatively, a range of frequencies may be
would be an advantage. However, there is a limit introduced, using the spectra implicit in pulses.
to the thickness of crystal material which remains The output spectra for four types of output signal