Page 597 - Instrumentation Reference Book 3E
P. 597

Ultrasonics  579


                                                             -4z.k
                                                                        L
                                                             A


                                                             aE--

                                                      Driving  L
                        Absorber                      current
                               k                                        L
                                                              Time           Frequency
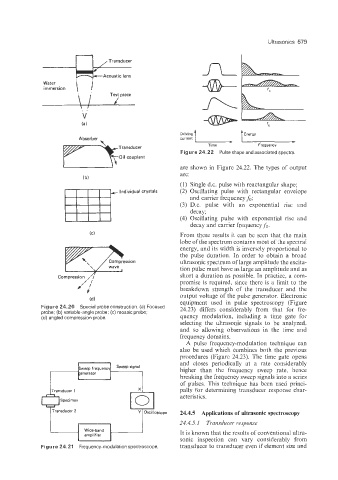
                                                      Figure 24.22  Pulseshape andassociated spectra.
                                                      are shown in  Figure 24.22. The types of  output
                                                      are:
                                                      (1)  Single d.c. pulse with reactangular shape;
                                    Individual crystals   (2)  Oscillating  pulse  with  rectangular  envelope
                                                         and carrier frequency so;
                                                      (3)  D.c.  pulse  with  an  exponential  rise  and
                                                         decay;
                                                      (4)  Oscillating  pulse  with  exponential  rise  and
                                                         decay and carrier frequency jb.
                                                      From these results  it  can be  seen that  the main
                                                      lobe of the spectrum contains most ofthe spectral
                                                      energy, and its width is inversely proportional  to
                                                      the pulse  duration. In  order  to  obtain  a  broad
                                                      ultrasonic spectrum of large amplitude the excita-
                    I                                 tion pulse must have as large an amplitude and as
                  Compression //:                     short a duration as possible. In practice, a com-
                        /' ;                          promise is required,  since there is a limit to the
                          /I
                                                      breakdown  strength  of  the  transducer  and  the
                                                      output voltage of the pulse generator. Electronic
                           (d)                        equipment  used  in  pulse  spectroscopy  (Figure
             Figure 24.20  Special probe construction. (a) Focused
             probe; (b) variable-angle probe: (c) mosaic probe;   24.23)  differs  considerably  from  that  for  fre-
             (d) angled compression pr'obe.           quency  modulation,  including  a  time  gate  for
                                                      selecting the  ultrasonic  signals to  be  analyzed,
                                                      and  so  allowing  observations  in  the  time  and
                                                      frequency domains.
                                                        A  pulse  frequency-modulation  technique  can
                                                      also be  used which combines both the previous
                                                      procedures  (Figure 24.23). The time  gate opens
                                                      and  closes  periodically  at  a  rate  considerably
                                                      higher  than  the  frequency  sweep  rate,  hence
                                                      breaking the frequency sweep signals into a series
                                                      of pulses.  This technique  has  been  used  princi-
                                                      pally for determining  transducer  response  char-
                 ransducer  1
                 3                                    acteristics.
                   Specimen
                 ransducer 2           9  Applications of ultrasonic spectroscopg
                                                      24.4.5
                                          Y
                                           Oscilloscope
               t                                      24.4.5. I   Transducer response
                                                      It is known that the results of conventional ukra-
                                                      sonic  inspection  can  vary  considerably  from
             Figure 24.21  Frequency-modulation spectroscope   transducer to transducer even if element size and
   592   593   594   595   596   597   598   599   600   601   602