
Page 290 - Integrated Wireless Propagation Models
P. 290
268 C h a p t e r F i v e
50
ill 40
:s I (a)
c I / ( b)
0
"iii 30 I
::J
c I
Q) I
1il 20 I
Q)
>
"iii
Qi
a: 1 0
0
1 0 1 0 0
Distance (m)
m
m
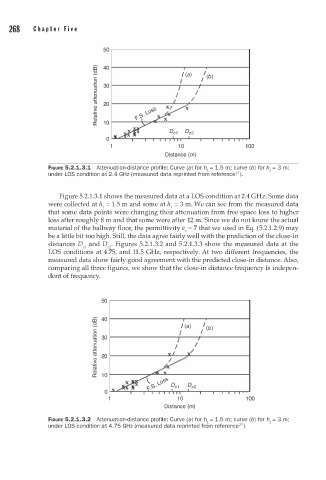
FIGURE 5.2.1.3.1 Attenuation-distance profile: Curve (a) for h1 = 1.5 ; curve (b) for h1 = 3 ;
2
a
u
under LOS condition t 2.4 GHz (meas r ed data reprinted from reference 7).
1
Figure 5.2. . 3.1 shows the measured data at a LOS condition at 2.4 GHz. Some data
were collected at h1 = 1 . 5 m and some at h1 = 3 m. We can see from the measured data
that some data points were changing their attenuation from free space loss to higher
loss after roughly 8 m and that some were after 12 m. Since we do not know the actual
material of the hallway floor, the permittivity £, = 7 that we used in Eq. (5.2.1.2.9) may
be a little bit too high. Still, the data agree fairly well with the prediction of the close-in
distances Dc1 and Dc 2 . Figures 5.2.1.3.2 and 5.2.1.3.3 show the measured data at the
LOS conditions at 4.75, and 11.5 GHz, respectively. At two different frequencies, the
measured data show fairly good agreement with the predicted close-in distance. Also,
comparing all three figures, we show that the close-in distance frequency is indepen
dent of frequency.
50
ill 40
:s I (a)
c / ( b)
0 I I
"iii 30
::J
c I
Q) I
1il 20
Q)
>
"iii
Qi
a: 1 0
1 0 1 0 0
Distance (m)
FIGURE 5.2.1.3.2 Attenuation-distance profile: Curve (a) for h1 = 1.5 ; curve (b) for h1 = 3 ;
m
m
2
a
under LOS condition t 4. 75 GHz (measured data reprinted from reference 7).