
Page 291 - Integrated Wireless Propagation Models
P. 291
I n - B u i I d i n g ( P i c o c e I ) P r e d i c t i o n M o d e I s 269
I
50
co 40
�
c
0
� 30
::J
c I
Q) I /
1ii 20
Q)
>
�
Qi
a: 1 0
0
1 0 1 0 0
Distance (m)
m
m
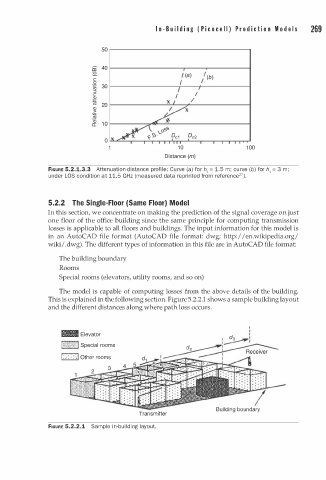
FIGURE 5.2.1.3.3 Attenuation-distance profile: Curve (a) for h1 = 1.5 ; curve (b) for h1 = 3 ;
a
u
under LOS condition t 11.5 GHz (meas r ed data reprinted from reference27).
5.2.2 The Single-Floor (Same Floor) Model
In this section, we concentrate on making the prediction of the signal coverage on just
one floor of the office building since the same principle for computing transmission
losses is applicable to all floors and buildings. The input information for this model is
:
in an AutoCAD file format (AutoCAD file format: dwg; http / /en.wikipedia.org/
wiki/ .dwg). The different types of information in this file are in AutoCAD file format:
The building boundary
Rooms
Special rooms (elevators, utility rooms, and so on)
The model is capable of computing losses from the above details of the building.
This is explained in the following section. Figure 5.2.2.1 shows a sample building layout
and the different distances along where path loss occurs.
111111111111 Elevator
[;;�ll��n:;j Special rooms
1':: : : : ;j Other rooms
Building boundary
Transmitter
i
FIGURE 5.2.2.1 Sample n -building layout.