
Page 160 - Introduction to Mineral Exploration
P. 160
7: GEOPHYSICAL METHODS 143
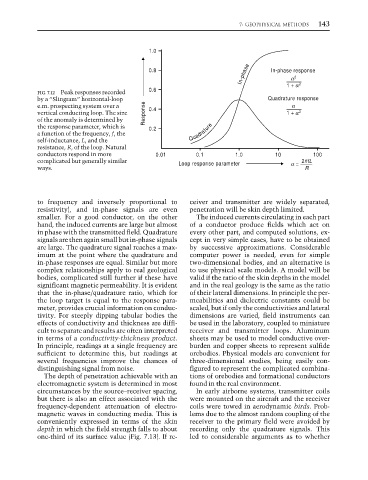
1.0
In-phase α α 2
0.8 In-phase response
FIG. 7.12 Peak responses recorded 0.6 1 + α α 2
by a “Slingram” horizontal-loop Quadrature response
e.m. prospecting system over a 0.4 α α
vertical conducting loop. The size Response 1 + α α 2
of the anomaly is determined by
the response parameter, which is 0.2
a function of the frequency, f, the Quadrature
self-inductance, L, and the
resistance, R, of the loop. Natural
conductors respond in more 0.01 0.1 1.0 10 100
π
complicated but generally similar Loop response parameter α = 2πfL
ways. R
to frequency and inversely proportional to ceiver and transmitter are widely separated,
resistivity), and in-phase signals are even penetration will be skin depth limited.
smaller. For a good conductor, on the other The induced currents circulating in each part
hand, the induced currents are large but almost of a conductor produce fields which act on
in phase with the transmitted field. Quadrature every other part, and computed solutions, ex-
signals are then again small but in-phase signals cept in very simple cases, have to be obtained
are large. The quadrature signal reaches a max- by successive approximations. Considerable
imum at the point where the quadrature and computer power is needed, even for simple
in-phase responses are equal. Similar but more two-dimensional bodies, and an alternative is
complex relationships apply to real geological to use physical scale models. A model will be
bodies, complicated still further if these have valid if the ratio of the skin depths in the model
significant magnetic permeability. It is evident and in the real geology is the same as the ratio
that the in-phase/quadrature ratio, which for of their lateral dimensions. In principle the per-
the loop target is equal to the response para- meabilities and dielectric constants could be
meter, provides crucial information on conduc- scaled, but if only the conductivities and lateral
tivity. For steeply dipping tabular bodies the dimensions are varied, field instruments can
effects of conductivity and thickness are diffi- be used in the laboratory, coupled to miniature
cult to separate and results are often interpreted receiver and transmitter loops. Aluminum
in terms of a conductivity-thickness product. sheets may be used to model conductive over-
In principle, readings at a single frequency are burden and copper sheets to represent sulfide
sufficient to determine this, but readings at orebodies. Physical models are convenient for
several frequencies improve the chances of three-dimensional studies, being easily con-
distinguishing signal from noise. figured to represent the complicated combina-
The depth of penetration achievable with an tions of orebodies and formational conductors
electromagnetic system is determined in most found in the real environment.
circumstances by the source–receiver spacing, In early airborne systems, transmitter coils
but there is also an effect associated with the were mounted on the aircraft and the receiver
frequency-dependent attenuation of electro- coils were towed in aerodynamic birds. Prob-
magnetic waves in conducting media. This is lems due to the almost random coupling of the
conveniently expressed in terms of the skin receiver to the primary field were avoided by
depth in which the field strength falls to about recording only the quadrature signals. This
one-third of its surface value (Fig. 7.13). If re- led to considerable arguments as to whether