
Page 117 - System on Package_ Miniaturization of the Entire System
P. 117
92 Cha pte r T h ree
Temperature
C
124.631
113.427
102.223
91.0194
79.8155
68.6116
57.4078
46.2039
Thermal impact between 35.0000
neighboring components
Thermal performance of the System level modeling
package in use condition
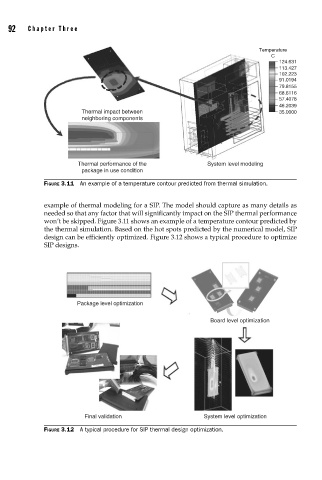
FIGURE 3.11 An example of a temperature contour predicted from thermal simulation.
example of thermal modeling for a SIP. The model should capture as many details as
needed so that any factor that will significantly impact on the SIP thermal performance
won’t be skipped. Figure 3.11 shows an example of a temperature contour predicted by
the thermal simulation. Based on the hot spots predicted by the numerical model, SIP
design can be efficiently optimized. Figure 3.12 shows a typical procedure to optimize
SIP designs.
Package level optimization
Board level optimization
Final validation System level optimization
FIGURE 3.12 A typical procedure for SIP thermal design optimization.