
Page 246 - System on Package_ Miniaturization of the Entire System
P. 246
220 Cha pte r F o u r
0 200
–20
S21, dB –40 LS21, deg. 100 0
–60
–80 Solid data: VCO1 –100 Solid data: VCO1
Sampled data: VCO2 Sampled data: VCO2
–100 –200
0 1 2 3 4 5 6 7 8 0 1 2 3 4 5 6 7 8
(a) (b)
FIGURE 4.66 Transformer frequency response. (a) Magnitude response of VCO1 and VCO2. (b) Phase
response of VCO1 and VCO2. VCO1 shows no out-of-band coupling.
band of interest (around 2 GHz) there is minimum discrepancy between the
two responses. However, in the case of TVCO2 the resonator elements couple
around 6 GHz. This is evident from the low insertion loss in the transformer
magnitude response. Based on modeling, it can be determined that the parasitic
inductance of capacitor C (2.5 pF) couples to inductor L (2 nH) [due to the low
2 2
self-resonant frequency (∼5 GHz) of C ]. Additionally at 6 GHz, it can be
2
observed that the phase response matches well to satisfy the oscillation
(Barkhausen) criterion (loop gain = 1∠0°). These effects coupled with the
broadband nature of the transistor G causes the center frequency of TVCO2 to
m
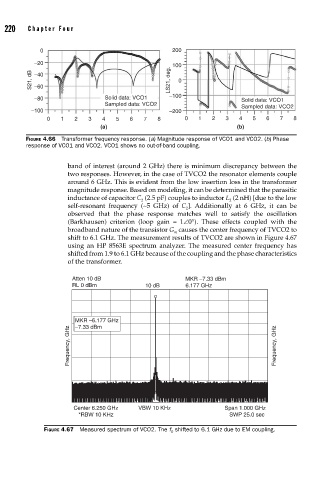
shift to 6.1 GHz. The measurement results of TVCO2 are shown in Figure 4.67
using an HP 8563E spectrum analyzer. The measured center frequency has
shifted from 1.9 to 6.1 GHz because of the coupling and the phase characteristics
of the transformer.
Atten 10 dB MKR −7.33 dBm
RL 0 dBm 10 dB 6.177 GHz
MKR −6.177 GHz
−7.33 dBm
Frequency, GHz Frequency, GHz
Center 6.250 GHz VBW 10 KHz Span 1.000 GHz
*RBW 10 KHz SWP 25.0 sec
FIGURE 4.67 Measured spectrum of VCO2. The f 0 shifted to 6.1 GHz due to EM coupling.