
Page 191 - Mechatronic Systems Modelling and Simulation with HDLs
P. 191
180 8 MICROMECHATRONICS
4.5
Saber simulation
Diameter: 50 µm
4.0
C [pF] 3.5
3.0
2.5
0 20 40 60 80
Pressure [bar]
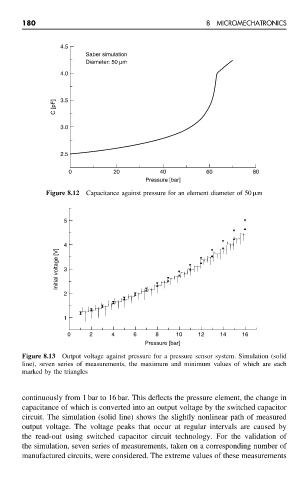
Figure 8.12 Capacitance against pressure for an element diameter of 50 µm
5
4
Initial voltage [V] 3
2
1
0 2 4 6 8 10 12 14 16
Pressure [bar]
Figure 8.13 Output voltage against pressure for a pressure sensor system. Simulation (solid
line), seven series of measurements, the maximum and minimum values of which are each
marked by the triangles
continuously from 1 bar to 16 bar. This deflects the pressure element, the change in
capacitance of which is converted into an output voltage by the switched capacitor
circuit. The simulation (solid line) shows the slightly nonlinear path of measured
output voltage. The voltage peaks that occur at regular intervals are caused by
the read-out using switched capacitor circuit technology. For the validation of
the simulation, seven series of measurements, taken on a corresponding number of
manufactured circuits, were considered. The extreme values of these measurements