
Page 301 - Pipeline Risk Management Manual Ideas, Techniques, and Resources
P. 301
13/278 Stations and Surface Facilities
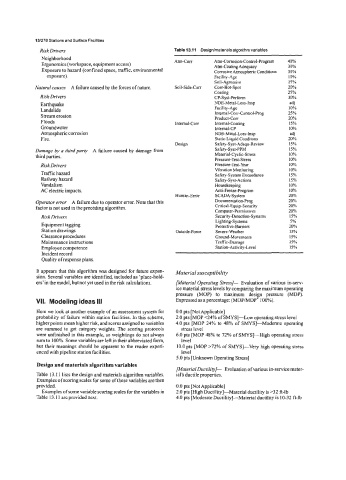
Risk Drivers Table 13.11 Designlmatenals algorithm variables
Neighborhood
Ergonomics (workspace, equipment access) Atm-Cor Atm-Corrosion-Control-Program 40%
Atm-Coating Adequacy
Exposure to hazard (confined space, traffic, environmental Corrosive Atmospheric Conditions 30%
30%
exposure). Facility-Age 10%
Soil-Agressive 15%
Natural causes A failure caused by the forces of nature. Soil-Side-Con Corr-Hot-Spot 20%
Coating 25%
Risk Drivers CP-Syst-Perform 30%
Earthquake NDE-Metal-Loss-Insp adj
Landslide Facility-Age 10%
Stream erosion Internal-Corr-Control-Prog 25%
Product-Corr
20%
Floods Internal-Corr Internal-Coating 15%
Groundwater Internal-CP 10%
Atmospheric corrosion NDE-Metal-Loss-Insp 4
Fire. Static-Liquid Conditons 20%
Design Safety-Syst-Adequ-Review 15%
Damage by a third party A failure caused by damage from Safety-Syst-PPM 15%
third parties. Material-Cyclic-Stress 10%
Pressure-Test-Stress 10%
Risk Drivers Pressure-Test-Year 10%
Traffic hazard Vibration Monitoring 10%
Safety-System Exceedance
15%
Railway hazard Safety-Syst-Actions 15%
Vandalism Housekeeping 10%
AC electric impacts. Anti-Freeze-Program 10%
Human-Error SCADA-S ystem 20%
Operator error A failure due to operator error. Note that this Documentation-Prog 20?6
factor is not used in the preceding algorithm. Critical-Equip-Security 20%
Computer-Permissives 20%
Risk Drivers Security-Detection-Systems 15%
Lighting-S ystems 5%
Equipment tagging Protective-Barriers 20%
Station drawings Outside-Force Severe-Weather 15%
Clearance procedures Ground-Movements 15%
Maintenance instructions Traffic-Damage 15%
Employee competence Station-Activity-Level 15%
Incident record
Quality of response plans.
It appears that this algorithm was designed for future expan- Material susceptibility
sion. Several variables are identified, included as ‘place-hold-
ers’in the model, but not yet used in the risk calculations. [Material Operating Stress]- Evaluation of various in-serv-
ice material stress levels by comparing the maximum operating
pressure (MOP) to maximum design pressure (MDP).
VII. Modeling ideas 111 Expressed as a percentage: (MOP/MDP’ 100%).
Here we look at another example of an assessment system for 0.0 pts [Not Applicable]
probability of failure within station facilities. In this scheme, 2.0 pts [MOP <24% of SMYSI-Low operating stress level
higher points mean higher risk, and scores assigned to variables 4.0 pts [MOP 24% to 48% of SMYSJ-Moderate operating
are summed to get category weights. The scoring protocols stress level
were unfinished in this example, so weighting do not always 6.0 pts [MOP 48% to 72% of SMYSI-High operating stress
sum to 100%. Some variables are left in their abbreviated form, level
but their meanings should be apparent to the reader experi- 10.0 pts [MOP >72% of SMYSI-Very high operating stress
enced with pipeline station facilities. level
5.0 pts [Unknown Operating Stress]
Design and materials algorithm variables
&faterial Ductili&]- Evaluation of various in-service mater-
Table 13.1 1 lists the design and materials algorithm variables. ial’s ductile properties.
Examples of scoring scales for some of these variables are then
provided. 0.0 pts ~otApplicable]
Examples of some variable scoring scales for the variables in 2.0 pts [High Ductility]-Material ductility is 232 ft-lb
Table 13.1 1 areprovidednext. 4.0 pts [Moderate Ductility]-Material ductility is 10-32 ft-lb